
 Add SeoProfy as a preferred source on Google

Virginia has the most data centers in the US when you count operating facilities and projects under construction or planned together.


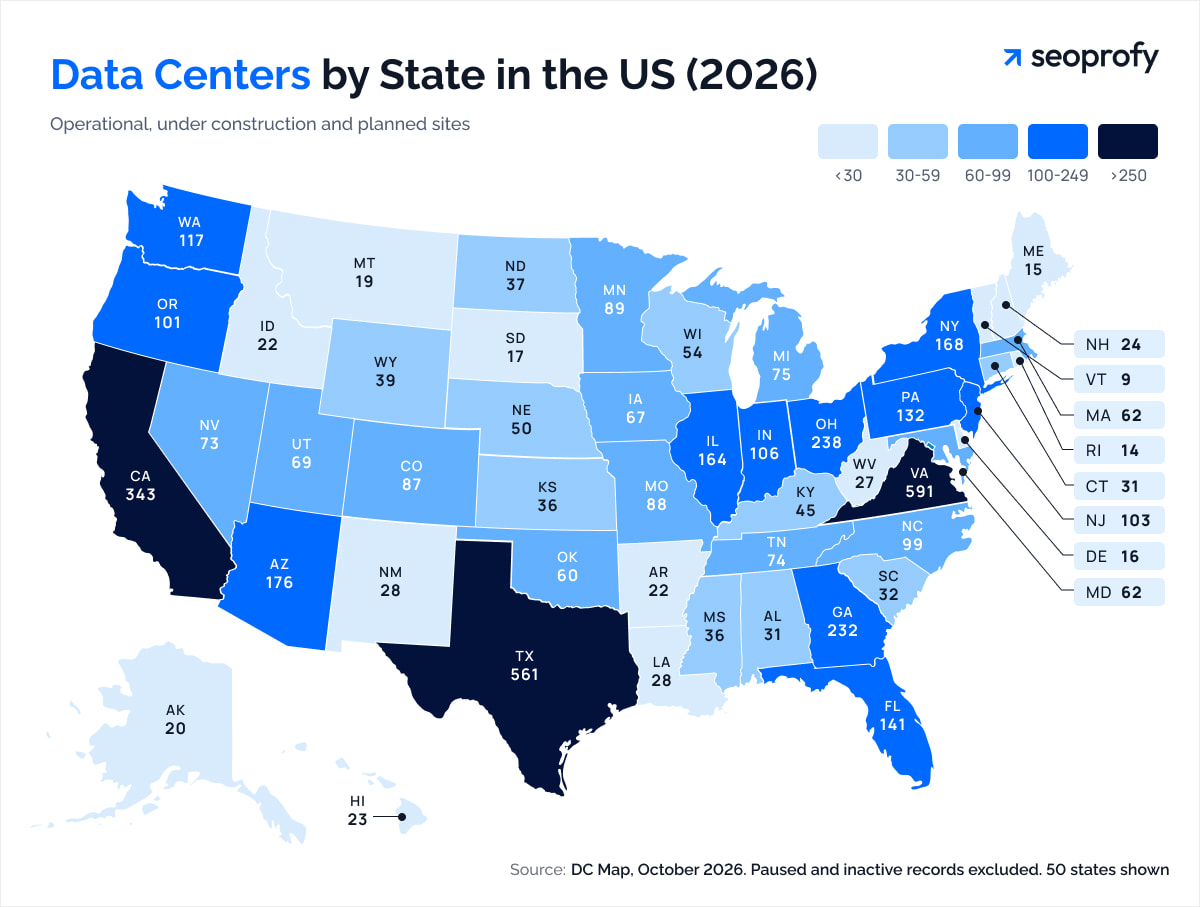
According to DC Map’s October 2026 inventory, Virginia leads with 591 sites and projects, followed by Texas with 561. However, Texas ranks first for operating facilities alone, with 314 compared with Virginia’s 298. This distinction matters because planned projects do not necessarily become operational.
Data Centers by State: Full List
To keep the number of data centers by state comparable, this table counts operational sites and projects under construction or planned. The Planned column combines the last two categories; paused and inactive records are excluded. The planned share is the combined project pipeline divided by the current total. The market column names a major market or cluster for each state.
| State | Main market or cluster | Total | Operating | Planned* | Planned share* |
| Virginia | Northern Virginia | 591 | 298 | 293 | 49.6% |
| Texas | Dallas–Fort Worth | 561 | 314 | 247 | 44.0% |
| California | Silicon Valley | 343 | 289 | 54 | 15.7% |
| Ohio | Columbus | 238 | 154 | 84 | 35.3% |
| Georgia | Atlanta | 232 | 112 | 120 | 51.7% |
| Arizona | Phoenix | 176 | 107 | 69 | 39.2% |
| New York | New York City metro | 168 | 142 | 26 | 15.5% |
| Illinois | Chicago | 164 | 125 | 39 | 23.8% |
| Florida | Miami / Orlando | 141 | 114 | 27 | 19.1% |
| Pennsylvania | Philadelphia | 132 | 79 | 53 | 40.2% |
| Washington | Seattle | 117 | 94 | 23 | 19.7% |
| Indiana | Indianapolis | 106 | 55 | 51 | 48.1% |
| New Jersey | Northern New Jersey | 103 | 90 | 13 | 12.6% |
| Oregon | Portland / The Dalles | 101 | 73 | 28 | 27.7% |
| North Carolina | Charlotte / Raleigh | 99 | 72 | 27 | 27.3% |
| Minnesota | Minneapolis–St. Paul | 89 | 49 | 40 | 44.9% |
| Missouri | Kansas City / St. Louis | 88 | 51 | 37 | 42.0% |
| Colorado | Denver | 87 | 74 | 13 | 14.9% |
| Michigan | Detroit | 75 | 60 | 15 | 20.0% |
| Tennessee | Nashville | 74 | 63 | 11 | 14.9% |
| Nevada | Las Vegas / Reno | 73 | 46 | 27 | 37.0% |
| Utah | Salt Lake City | 69 | 45 | 24 | 34.8% |
| Iowa | Des Moines | 67 | 40 | 27 | 40.3% |
| Maryland | Baltimore | 62 | 37 | 25 | 40.3% |
| Oklahoma | Oklahoma City / Tulsa | 60 | 34 | 26 | 43.3% |
| Massachusetts | Greater Boston | 56 | 56 | 0 | 0% |
| Wisconsin | Milwaukee | 54 | 43 | 11 | 20.4% |
| Nebraska | Omaha | 50 | 40 | 10 | 20.0% |
| Kentucky | Louisville | 45 | 30 | 15 | 33.3% |
| Wyoming | Cheyenne | 39 | 26 | 13 | 33.3% |
| North Dakota | Fargo | 37 | 15 | 22 | 59.5% |
| Kansas | Wichita | 36 | 21 | 15 | 41.7% |
| Mississippi | Jackson | 36 | 17 | 19 | 52.8% |
| South Carolina | Columbia / Greenville | 32 | 19 | 13 | 40.6% |
| Alabama | Birmingham | 31 | 18 | 13 | 41.9% |
| Connecticut | Hartford | 31 | 26 | 5 | 16.1% |
| New Mexico | Albuquerque | 28 | 20 | 8 | 28.6% |
| Louisiana | New Orleans / Baton Rouge | 28 | 19 | 9 | 32.1% |
| West Virginia | Kearneysville | 27 | 16 | 11 | 40.7% |
| New Hampshire | Manchester | 24 | 24 | 0 | 0% |
| Hawaii | Honolulu | 23 | 17 | 6 | 26.1% |
| Arkansas | Little Rock | 22 | 16 | 6 | 27.3% |
| Idaho | Boise | 22 | 16 | 6 | 27.3% |
| Alaska | Anchorage | 20 | 16 | 4 | 20.0% |
| Montana | Bozeman | 19 | 16 | 3 | 15.8% |
| South Dakota | Sioux Falls | 17 | 8 | 9 | 52.9% |
| Delaware | Wilmington | 16 | 16 | 0 | 0% |
| Maine | Portland | 15 | 13 | 2 | 13.3% |
| Rhode Island | Providence | 14 | 14 | 0 | 0% |
| Vermont | Burlington | 9 | 9 | 0 | 0% |
The 50 state rows total 4,747. The national total of 4,771 also includes 13 entries for the District of Columbia and 11 for Puerto Rico.
* “Planned” includes projects under construction and planned. The source tracks them separately, but this table combines them to match the brief’s operating-versus-planned comparison. The planned share is calculated by dividing planned by total.
State counts come from DC Map’s October 2026 inventory, an independently maintained database that compiles public company announcements, permit filings, utility and regulatory records, news reports, and other public sources. Its methodology cross-references records where possible, then deduplicates and classifies them by lifecycle.
Top 10 States With the Most Data Centers
Facility counts show where data centers already operate; the development pipeline points to where the footprint may expand. The markets below combine established hubs with states where construction and planning are adding to existing capacity.
1. Virginia
Operational facilities: 298
Under construction or planned: 293
Total tracked sites: 591
Loudoun County sits at the center of Northern Virginia’s data center cluster, while development is also moving south into Prince William County. A Virginia legislative report points to the region’s appeal: fiber connectivity, reliable power, available land, nearby customers, and tax incentives.
DC Map’s October 2026 inventory shows how close the next wave of development is to Virginia’s existing data center cluster. Dominion Energy’s approved Hornbaker–Devlin project will add a transmission line and switching station to support data center growth in Prince William County.
2. Texas
Operational facilities: 314
Under construction or planned: 247
Total tracked sites: 561
Dallas–Fort Worth is Texas’s main data center market, with development also spreading to other parts of the state. The Texas Comptroller’s program offers sales tax exemptions for qualifying projects, while the region attracts operators seeking land and power.
In its H2 2025 market report, CBRE counted about 700 MW of colocation space under construction in Dallas–Fort Worth, 94.5% of it preleased.
3. California
Operational facilities: 289
Under construction or planned: 54
Total tracked sites: 343
Silicon Valley is California’s largest established market, serving technology companies and users that need infrastructure close to their operations. That proximity supports the market, but power and construction costs limit expansion. CBRE’s H2 2025 analysis describes modest growth amid power constraints. The inventory shows a smaller project pipeline relative to the state’s operating base.
4. Ohio
Operational facilities: 154
Under construction or planned: 84
Total tracked sites: 238
Central Ohio, particularly the Columbus area, benefits from available land, transmission access, and proximity to customers, according to the Ohio Consumers’ Counsel. The area also has a long-standing hyperscale presence: Google reports more than $20 billion in investment in the state since breaking ground in New Albany in 2019.
The project pipeline is smaller than Ohio’s operating base. Growth may face a policy constraint: the governor directed the state to pause consideration of new data center tax exemption requests while lawmakers study the industry.
5. Georgia
Operational facilities: 112
Under construction or planned: 120
Total tracked sites: 232
Atlanta is Georgia’s primary data center hub, with demand driven by hyperscale and AI infrastructure projects. CBRE’s H2 2025 report highlights more than 3 GW of power commitments while noting transmission constraints as multiple large developments seek grid connections. The project pipeline slightly exceeds the state’s operating base.
6. Arizona
Operational facilities: 107
Under construction or planned: 69
Total tracked sites: 176
Phoenix leads Arizona’s market. Operators are drawn by relatively competitive power costs and tax incentives, as CBRE notes in its Phoenix market coverage. CBRE recorded 256 MW of colocation space and power absorption across four Phoenix projects in the second half of 2025. That gives the state a sizeable project pipeline relative to its current footprint.
7. New York
Operational facilities: 142
Under construction or planned: 26
Total tracked sites: 168
New York City and its surrounding metro area anchor the state’s data center activity, supported by demand from businesses that need infrastructure near users and financial markets. But the region’s expansion is constrained: CBRE’s H2 2025 New York Tri-State report cites high power costs and limited tax incentives.
DC Map’s October 2026 inventory shows an established operating base alongside a smaller project pipeline.
In July 2026, Gov. Kathy Hochul signed an executive order pausing discretionary state environmental permits for data centers for up to a year while officials develop new standards. Developers whose projects need those permits will have to wait until the state finishes its review before moving forward.
8. Illinois
Operational facilities: 125
Under construction or planned: 39
Total tracked sites: 164
Chicago is Illinois’s main data center market and one of North America’s established hubs. CBRE’s Chicago market profile notes that development is moving outside the city, often to sites targeting power availability above 500 MW. The state’s project pipeline remains smaller than its established operating base.
9. Florida
Operational facilities: 114
Under construction or planned: 27
Total tracked sites: 141
Florida’s data center activity spans several markets, including Miami and Orlando. Miami’s position as a connection point for Latin American networks helps explain its role: the city’s Network Access Point provides a major route for data moving between the region and the rest of the world.
Florida’s project pipeline is smaller than in the leading growth states, but utilities have also pursued dedicated rate structures for large-load customers. FPL lists large-load contract service rates, and Duke Energy Florida petitioned the Florida PSC to approve a large-load tariff.
10. Pennsylvania
Operational facilities: 79
Under construction or planned: 53
Total tracked sites: 132
Pennsylvania’s data center activity clusters around Philadelphia and other areas with access to power and regional markets. Its proximity to New York and Northern Virginia, along with available energy resources, has attracted major investment.
In June 2025, Amazon announced plans to invest at least $20 billion in multiple AI and cloud campuses across Pennsylvania. Salem and Falls Townships were the first two communities named.
DC Map’s October 2026 inventory shows a smaller project pipeline alongside the state’s operating facilities. In August 2026, Pennsylvania introduced stricter permitting requirements for data center projects.
Under the new executive order, developers must meet the state’s GRID requirements and obtain all necessary local approvals before receiving state permits. The order also removes AI data center proposals from the state’s fast-track permitting program.
What Is Driving Data Center Growth Across the U.S.?
Demand growth is also reaching markets beyond the established Northern Virginia hub. The U.S. Energy Information Administration expects:
- The ERCOT and PJM regions will experience the fastest growth in power demand for data centers through 2027.
- Continued demand growth in Arizona and Nevada.
These are regional forecasts, not a state-by-state count, but they show where utilities may face pressure to serve new facilities.
Lawrence Berkeley National Laboratory’s 2025 update estimates that data centers could use 11.8% of U.S. electricity by 2030, with scenarios ranging from 9.5% to 15.3%.
The forecasts measure electricity demand, while the table tracks facilities. Read these forecasts alongside local grid capacity and permitting conditions to assess which projects are more likely to move forward.
For developers, the next step is local:
- available power
- grid connection timelines
- fiber access
- land
- permits
Tax incentives can affect project economics, but they won’t speed up a delayed power connection.
A project pipeline can grow quickly, but power availability, permits, and local infrastructure determine which proposals reach operation.
Why Facility Counts Don’t Tell the Whole Story
A state ranking is useful only when you know what its numbers include. One inventory may count operational data centers; another may also include construction projects and proposed sites. Both can describe their records accurately while answering different questions. Check the status categories before comparing state totals.
- Operational: facilities already serving customers.
- Under construction: projects where building work is underway.
- Planned: proposed or announced sites that have not opened.
Treating every planned project as an existing facility overstates a state’s current footprint.
What Does a Directory Mean by a “Site”?
A directory’s “site” may mean one building, a multi-building campus, or a project location. One database might count five buildings at one address separately; another may group them as one campus. Neither approach is automatically wrong, but totals based on different definitions are not directly comparable. This distinction matters especially in markets with large campuses.
A company listing also does not necessarily show ownership or capacity. A cloud provider may lease space in a colocation facility, while a developer may appear in project records before naming a customer. Readers comparing data center companies should check what each listing represents. A listing count may reflect market presence without showing how many facilities a company owns or how much computing capacity it controls.
Facility Count Is Not Capacity
Two states can have the same number of operational facilities but very different infrastructure. One may have many smaller sites serving local users; another may have a few large campuses built for hyperscale cloud computing or artificial intelligence. Building count alone cannot show how much space, computing equipment, or electricity they require.
Capacity figures help add that context, but reports use different measures. Some describe a facility’s total power, while others report the share available to IT equipment. Power capacity and actual consumption are not interchangeable; both offer information a facility count cannot.
Read the Pipeline Separately
Keep operational facilities, projects under construction, and planned sites distinct. A large pipeline signals development interest, but it does not guarantee that every project will open. Permits, financing, construction timelines, land, fiber access, tax treatment, proximity to users, and grid capacity can affect whether a proposal moves forward.
Use facility counts to compare the entries in a particular inventory. To understand the wider data center industry in each state, read those totals alongside project status and available capacity or power-use data. For state comparisons, the source’s methodology matters as much as its headline total.
Frequently Asked Questions
Which City Has the Most Data Centers?
Ashburn, in Loudoun County, is usually the answer. The town sits at the center of Northern Virginia’s Data Center Alley, one of the country’s best-known clusters.
A precise city ranking is hard to pin down, though: directories do not all count sites the same way. Some list each building separately; others record an entire campus as one facility.
Which States Have the Fewest Data Centers?
According to the October 2026 DC Map inventory, Vermont has the fewest tracked sites and projects, with nine. Rhode Island follows with 14, then Maine with 15, Delaware with 16, and South Dakota with 17.
These records are operational, under construction, or planned; paused and inactive entries are excluded. A ranking limited to operating facilities could differ.
Where Are New Data Centers Being Built?
In DC Map’s October 2026 inventory, Virginia has 293 sites in the construction or planning pipeline, while Texas has 247; Georgia is next at 120. Pennsylvania, Ohio, and Arizona also have projects listed.
This is a snapshot of projects at mixed stages, from construction to planning, so the numbers do not predict how many facilities will ultimately open.
What States Will Have the Most Data Centers?
Based on DC Map’s October 2026 inventory, Virginia and Texas are best positioned to remain near the top: they lead in total facility counts and have the largest project pipelines.
Georgia and Pennsylvania also have sizable project pipelines. Rankings can shift as projects secure power, permits, and financing or move through construction; planned sites are not guaranteed to become operational.
How Many Data Centers Are There in the US?
DC Map’s October 2026 inventory tracks 4,771 facilities and projects across the country: 3,172 are operational, 400 are under construction, and 1,199 are planned.
The total varies by source because some count only operating sites, while others also include projects that have not opened. For an operating-only figure, use 3,172.
Which Data Center Company Is the Biggest in the US?
Amazon is among the largest U.S. data center operators by tracked sites and projects. DC Map’s October 2026 consolidated Amazon profile, which includes AWS and Vadata, lists 301 operating, under-construction, and planned facilities and projects. However, the largest operator can differ depending on whether rankings use facility count, capacity, or revenue.
The total covers Amazon-associated sites and projects, not a ranking by capacity or revenue. The DC Map also lists six paused or historical records separately.
The Bottom Line
Virginia is the answer to what state has the most data centers when operational, under-construction, and planned sites are counted together: The DC Map lists 591 in total. But the result changes with the definition.
Texas has more operational facilities — 314 compared with Virginia’s 298 — so Texas leads if the ranking includes only sites already running. That distinction matters when comparing today’s footprint with future expansion.
The state table also shows growth isn’t limited to the oldest hubs. Georgia’s construction and planning pipeline is larger than its operating count, while Ohio, Arizona, and Pennsylvania have projects that could add capacity to their regional markets.
Those proposals are not guaranteed openings; permits, financing, construction schedules, and power connections will determine which ones become operational.

Julia Lubianytska is a Copywriting Team Lead at SeoProfy with over 7 years of experience in copywriting and editing. She works closely with copywriting teams, helping writers craft clear and thoughtful content for SaaS products, IT services, and businesses in the legal and medical fields. Julia enjoys turning complex topics into easy-to-understand, trustworthy content, focusing on structure, clarity, and consistency to ensure the content is genuinely helpful for real people, not just search engines.