


Global ecommerce sales are forecast to reach $6.88 trillion in 2026, accounting for 21.1% of all retail sales. Yet a larger market does not automatically mean easier growth, as tighter margins and rising costs of online payment fraud make profitability harder to maintain.


This ecommerce stats report brings together the numbers retailers need for 2026 planning. It starts with worldwide and US sales. Then it moves into shopper behavior, mobile commerce, social commerce, platform share, checkout drop-off, returns, fraud, and AI adoption. Use these figures to compare your online store against the wider market, spot where growth is becoming more expensive, and stay ahead of the competition.
- US ecommerce sales reached $326.7 billion in Q1 2026, up 9.8% year over year. Ecommerce accounted for 16.9% of total US retail sales that quarter. (U.S. Census Bureau)
- Worldwide total online retail sales are forecast to reach $6.88 trillion in 2026. That is up from $6.42 trillion in 2025, with the market on track to hit $7.89 trillion by 2028. (Shopify)
- Cart abandonment sits at 70.22%, based on Baymard’s average across 50 studies. High extra costs remain the top checkout issue. (Baymard Institute)
- During Q1 2026, only 1.4% of visits to brand websites worldwide converted into retail purchases. This shows how narrow the gap is between traffic and revenue. (Statista)
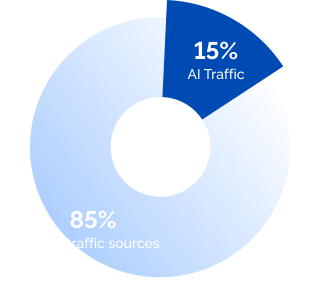
- In Q1 2026, traffic from AI sources to US retail sites grew 393% YoY, underscoring how quickly AI search and assistants are entering the ecommerce journey. (Adobe Digital Insights)
Our Methodology
The SeoProfy team collected ecommerce stats from multiple sources and carefully narrowed them down. The final list includes figures useful for understanding the market and reliable enough to cite.
What we include:
- Official ecommerce and retail datasets
- Original reports from recognized research publishers
- Platform data with a clear methodology
- Benchmarks from ecommerce, payment, fraud, and analytics providers.
How we choose sources: We trace each piece of ecommerce stats back to the original source whenever possible. Census data, company reports, market research, economic growth data, and platform studies take priority because they show where the number comes from and how it was measured.
Our freshness rule: This article focuses on the most recent available data, published from 2025 onward (2025 is mentioned only as a baseline for comparison). You will not find outdated ecommerce stats here.
Overview: Why Ecommerce Statistics Matter in 2026
Ecommerce stats matter because they show how online retail is actually working in 2026. They help you understand worldwide ecommerce sales, market demand, shopper behavior, checkout drop-off, mobile buying, social commerce, platform choice, operations, fraud, and AI adoption in one context.
Use these numbers next to your own store data. They show where your store follows the market. They also show where revenue may be leaking through weak conversion, poor mobile performance, limited payment options, return pressure, or the wrong channel focus.
This page focuses on global ecommerce market data. For campaign metrics, channel performance, and advertising benchmarks, see our ecommerce marketing statistics guide.
Global E-commerce Sales and Market Size
How big is the e-commerce market in 2026? Global B2C retail e-commerce sales are forecast to reach $6.88 trillion, with online sales taking 21.1% of total retail worldwide.
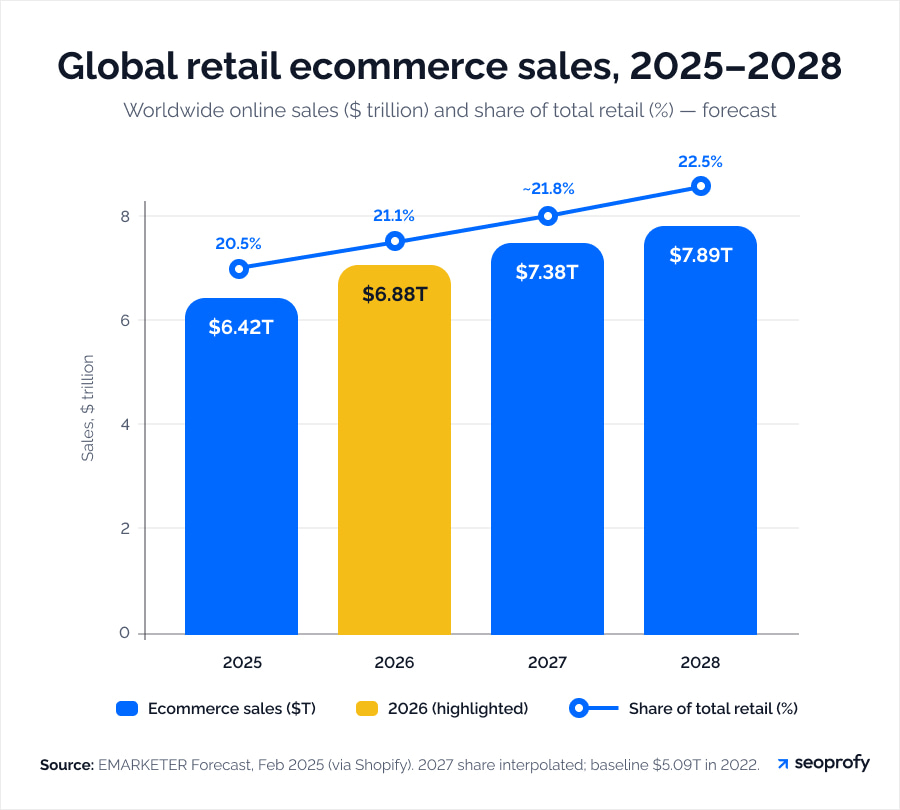
Global retail e-commerce is forecast to grow 7.2% in 2026. The growth rate is slightly higher than the 6.8% estimated for 2025. (Shopify)
Online sales are expected to cross one-fifth of global retail in 2026. By 2028, the share is forecast to reach 22.5%. (Shopify)
The wider global e-commerce market (B2B plus B2C combined) is expected to reach $39.70 trillion in 2026. By 2033, it is projected to grow to $155.98 trillion. (Grand View Research)
US retail e-commerce sales reached $326.7 billion in Q1 2026, up 9.8% year over year. E-commerce made up 16.9% of total US retail sales that quarter. (U.S. Census Bureau)
Consumer electronics and fashion are the two largest growing product categories globally, with sales expected to reach 1.1 trillion and 1.3 trillion, respectively, in 2027. (US International Trade Administration)
B2B E-commerce Market Size
The global B2B e-commerce market is projected to reach $28 trillion in 2026. By 2033, it is expected to grow to $105.9 trillion. (Grand View Research)
Global B2B e-commerce is forecast to grow at a 20.9% CAGR from 2026 to 2033. (Grand View Research)
When measured by gross merchandise value, the B2B e-commerce market is estimated at $36.86 trillion in 2026. By 2031, experts predict it will reach $61.66 trillion. (Mordor Intelligence)
North America’s B2B e-commerce market is estimated at $6.14 trillion in 2026. By 2031, it is projected to reach $14.49 trillion. (Mordor Intelligence)
Number of Online Shoppers and How People Shop
Nowadays, online shopping spans several buying paths. Retailer sites still matter, but apps, marketplaces, social platforms, international retailers, and AI tools now sit inside the same purchase journey.
The global internet audience reached 6.12 billion people in April 2026, giving ecommerce its largest reachable market so far. (DataReportal)
72% of shoppers are app-first, while only 38% of ecommerce small businesses offer browsing and buying through their own app. (DHL eCommerce)
Traffic from AI sources to U.S. retail sites grew 393% YoY in Q1 2026. In March 2026, AI-referred traffic converted 42% better than non-AI traffic. (Adobe Digital Insights)
70% of online shoppers have purchased from retailers outside their own country, showing that international shipping is now part of mainstream ecommerce behavior. (DHL eCommerce)
38% of shoppers have used AI-powered chat or virtual assistants to browse or buy online. (DHL eCommerce)
According to social commerce statistics, 45% of shoppers buy through social media, while 63% of businesses sell there. (DHL eCommerce)
Generational Differences in Online Shopping
Generational differences are most evident in discovery, payment preferences, AI use, and resale behavior. Younger shoppers move faster through social and AI-led journeys. Older shoppers are still active online, but they lean more on trust signals, delivery control, and familiar platforms.
58% of Gen Z shoppers have purchased something through TikTok. 41% say influencer or celebrity posts affect their buying decisions. (DHL eCommerce)
32% of Millennials make an online purchase more than once a week. (DHL)
68% of Gen X shoppers have bought an item or product through Facebook. 46% want to use AI in the future to compare prices. (DHL eCommerce)
55% of Baby Boomers prefer out-of-home pickup points because they are flexible. 53% return items through a parcel shop or convenience store. (DHL eCommerce)
Adults under 35 are more than twice as likely as those over 55 to use TikTok, Instagram, or Reddit to check a retailer’s reputation before buying online: 43% vs. 21%. (YouGov)
In the U.S., Gen Z online shoppers aged 18–24 most often prefer debit cards, with usage at 53%. More than 30% of shoppers aged 25–44 usually pay for online purchases with credit cards. (TGM Research)
Pureplay online channels (the ones selling exclusively through digital platforms) gained across all generations in general merchandise, with Gen Z and Boomers each up 1.2 percentage points. (Numerator)
AI shopping adoption is highest among younger consumers: 79% of Gen Z and 77% of Millennials use AI-powered tools to discover or research products, compared with 60% of Gen X and 36% of Baby Boomers. (Salsify)
Online Shopping Behavior: Conversion, Cart Abandonment, and Drivers
Ecommerce lead generation shows great numbers. Shoppers in 2026 are as curious as ever, checking out tons of options before settling on one. But the sale really comes down to whether that final stretch toward checkout feels honest and easy to trust.
Conversion and cart abandonment should be read together. A low conversion rate can point to weak product content before checkout. A high abandonment rate often indicates additional costs, delivery concerns, payment limits, or trust issues at the final step.
In Q1 2026, 1.4% of ecommerce website visits worldwide ended in a purchase. (Statista)
E commerce statistics show the average documented online cart abandonment rate is 70.22%, based on 50 studies tracked by Baymard. (Baymard Institute)
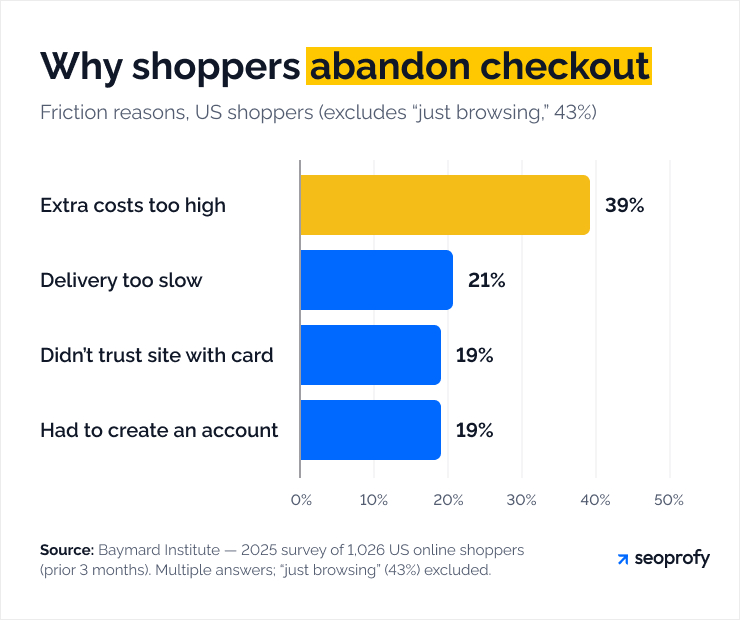
Among US shoppers with real purchase intent, high extra costs were the leading reason for checkout abandonment at 39%. Slow delivery followed at 21%. Payment trust and forced account creation each reached 19%. (Baymard Institute)
Delivery options caused 67% of new customers to abandon a purchase in DHL’s 2026 survey. Returns were another major blocker, cited by 58%. (DHL eCommerce)
Payment choice still breaks checkout. 62% of shoppers say they abandon a purchase when their preferred payment method is missing. (DHL eCommerce)
Free shipping now beats the lowest product price when shoppers choose where to buy online: more shoppers (57%) cite shipping costs, compared with 45% citing the lowest price, which highlights shopper expectations in 2026. (Bizrate Insights)
Price and convenience remain the main reasons people choose online shopping over stores. 65% cite better prices, and 64% cite convenience. (Salsify)
62% of consumers stop a purchase when shipping is required, and they have to pay for it. 81% of Americans are willing to add items to reach a free shipping threshold. (Capital One Shopping)
Mobile Commerce Statistics
Mobile commerce is moving from browsing to full purchase completion. Phones now carry the sale from the first product check to payment, so mobile performance affects order volume and checkout quality.
The global m-commerce market is projected to reach $2.82 trillion in 2026. By 2031, it is expected to grow to $4.16 trillion. (Mordor Intelligence)
M-commerce is forecast to grow at an 8.09% CAGR from 2026 to 2031. (Mordor Intelligence)
In April 2026, the world had 5.83 billion unique smartphone users, equal to 70.4% of the global population. (DataReportal)
Smartphones accounted for roughly 89% of mobile phones in use worldwide in April 2026. (DataReportal)
Mobile accounts for over 62% of global web traffic and 77% of retail visits. (SeoProfy’s SEO statistics)
96.2% of internet users went online by mobile at least part of the time. (DataReportal)
Smartphones drove 56.4% of online transactions during the latest U.S. holiday season tracked by Adobe. On Christmas Day, that share reached 66.5%. (Adobe Analytics)
In Latin America, 84% of ecommerce purchases are made on smartphones. The region’s online sales are projected to reach $215.31 billion in 2026. (Reuters)
Mobile commerce is forecast to grow at a 9.5% CAGR from 2026 to 2034. (Fortune Business Insights)
US retail ecommerce is expected to become majority-mobile in 2027. Mobile devices will take more than 50% of online retail sales a year earlier than previously forecast. (EMARKETER)
Social Commerce and Shopping via Digital Channels
Social commerce now influences buying decisions much closer to checkout. A product can move from a short video to a marketplace listing to checkout in the same session, which makes social platforms part of the buying path rather than only a place for discovery. So, ecommerce digital marketing efforts now need to account for social platforms as both acquisition and sales channels.
US social commerce sales are projected to pass $100 billion in 2026, up 18% year over year. (Worldpay)
Among social commerce buyers, Instagram and YouTube rank as the leading preferred platforms. (Capgemini Research Institute)
The newest ecommerce stats show TikTok becoming a core shopping platform in the US. 51% of US social buyers are expected to shop online on TikTok in 2026. (EMARKETER)
TikTok Shop is forecast to reach $23.41 billion in US ecommerce sales in 2026, after 48% year-over-year growth. (EMARKETER)
TikTok buyers in the US are expected to reach 57.7 million in 2026, up 8.6% from 2025. (EMARKETER)
Online marketplaces are still the top research channel for products and brands, used by 51% of shoppers before purchase. (Salsify)
Social media is the leading research channel for younger shoppers: 63% of Gen Z and 55% of Millennials name platforms like TikTok and Instagram as their top place to research products. (Salsify)
35% of consumers bought something through a social media platform in the latest Capgemini consumer survey. (Capgemini Research Institute)
Influencer recommendations still convert some shoppers, but they are far from universal. Only 23% of shoppers bought a product online after an influencer recommended it. (Salsify)
Influencer and affiliate links drove about one-quarter of US retail site revenue during the latest holiday season. (Adobe)
Social media ranks 3rd among product discovery channels, reaching 52% of shoppers in Salsify’s 2026 consumer research. (Salsify)
Ecommerce Sector and Platform Statistics: Market Share
Ecommerce platforms compete in different ways. WooCommerce leads in many store-count datasets, Shopify shows strong merchant sales volume, and Amazon still wins marketplace transactions.
There are 13.71 million live ecommerce businesses across 100 ecommerce platforms in the 2026 dataset. WooCommerce leads by store count with 4.24 million stores, followed by Shopify with 2.88 million. (StoreLeads)
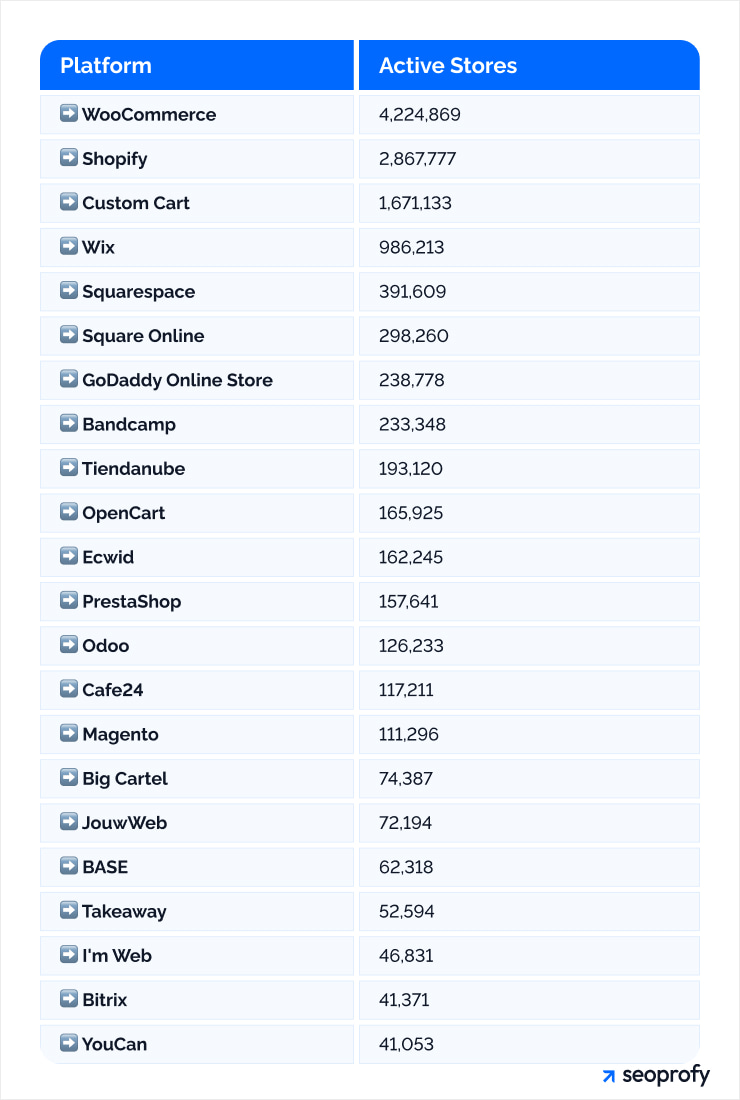
In ecommerce-system usage, WooCommerce holds almost half (48.6%) of the market. Shopify follows with 31.0%. (W3Techs)
Among the top 10,000 sites, Shopify appears on 191 ecommerce sites. Magento appears on 91, while Salesforce Commerce Cloud appears on 63. (BuiltWith)
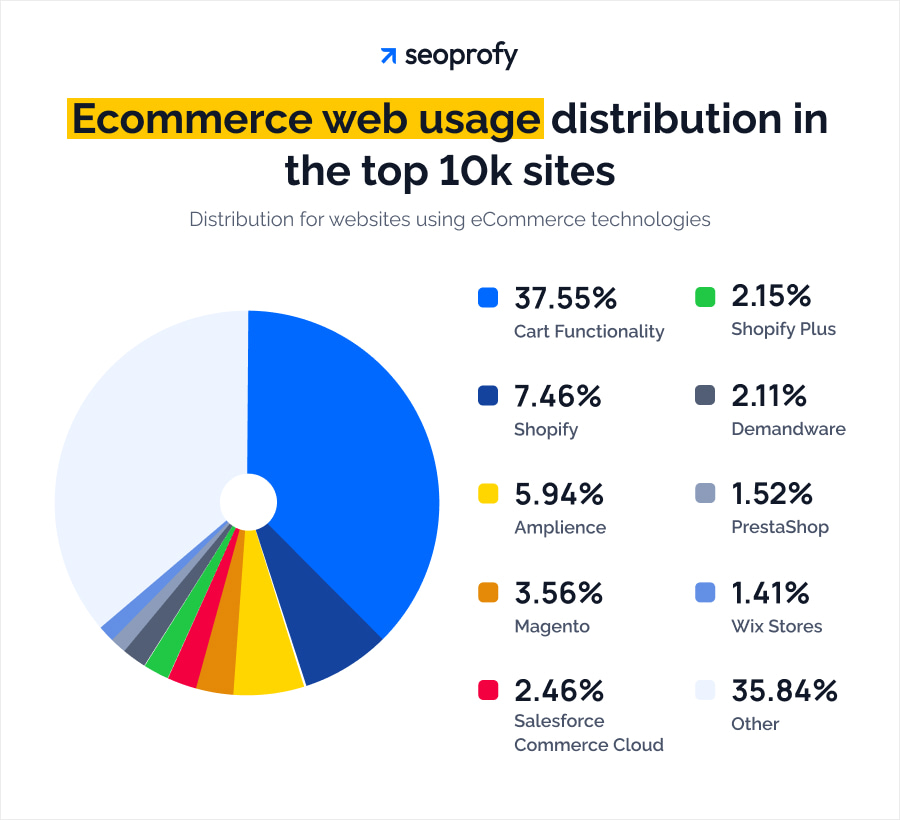
WooCommerce Checkout is active on 3.44 million live websites. The U.S. accounts for 1.70 million of those sites. (BuiltWith)
Shopify merchants processed $100.74 billion in GMV in Q1 2026, up from $74.75 billion in Q1 2025. (Shopify)
Third-party sellers accounted for 60% of paid units sold on Amazon in Q1 2026. That share was down from 61% in Q4 2025 and 62% one quarter earlier. (Marketplace Pulse)
Operations, Returns, and Fraud: The Hidden Costs
Ecommerce growth looks much smaller once delivery, returns, fraud checks, and dispute handling are counted. These costs sit after the sale, so they often show up only when orders are already cutting into margin.
Online return volume in the US is expected to rise 6.3% in 2026 and reach almost $379 billion. (EMARKETER)
Ecommerce will account for almost 48% of US retail returns by 2029, while total retail returns are projected to reach $951.36 billion. (EMARKETER)
Global ecommerce logistics is projected to reach $624.33 billion in 2026 and grow to $2.50 trillion by 2034. (Fortune Business Insights)
In Europe, almost half (48%) of online shoppers abandoned a cart because of delivery issues in the previous three months. 77% had at least one problem with their most recent delivery. (Sendcloud)
Payment fraud takes 3.2% of total annual ecommerce revenue globally. (Merchant Risk Council)
First-party misuse is rising fast: 64% of merchants report an increase in friendly fraud. (Visa Acceptance Solutions)
Refund and policy abuse increased for 57% of merchants over the past year. (Merchant Risk Council)
Ecommerce fraud losses are expected to climb from $56 billion in 2025 to $131 billion in 2030. (Juniper Research)
Technology, AI, and Future Ecommerce Trends
According to the freshest ecommerce stats, AI is starting to send shoppers into ecommerce with clearer intent. Retailers can already see the difference in traffic quality when visitors arrive from AI tools.
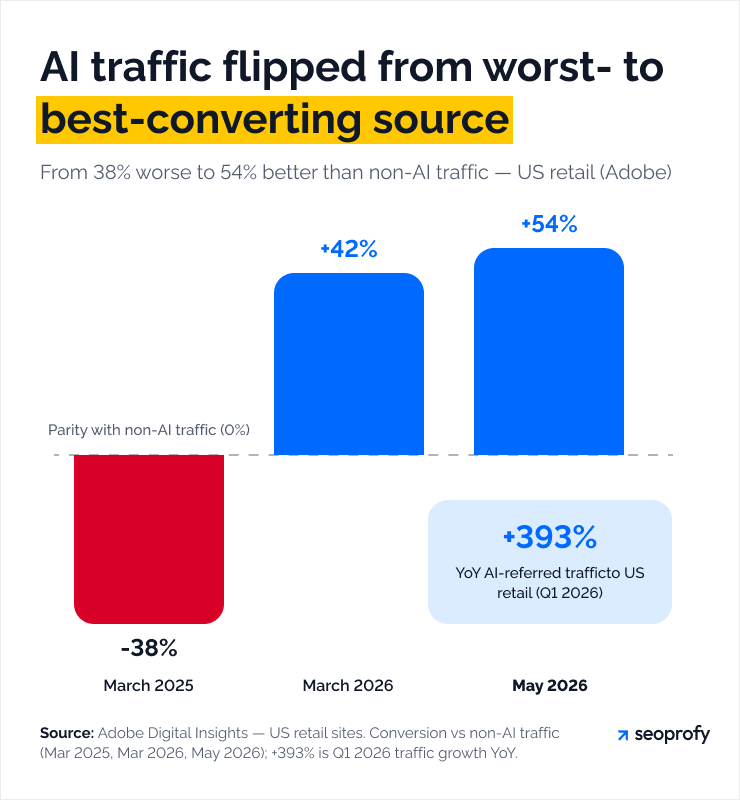
AI-referred retail visitors converted 54% better than non-AI traffic in May 2026. A year earlier, AI traffic converted at nearly half the rate of other visits. (Adobe Digital Insights)
25% of consumers have already used GenAI shopping tools, and another 31% plan to use them. At the same time, 76% want clear rules for when an AI assistant acts. (Capgemini Research Institute)
With more than 800 million weekly ChatGPT users, AI tools are becoming a major place where shoppers research products before choosing where to buy. (ChatGPT Shopping, SeoProfy)
Only 14% of shoppers trust AI recommendations when deciding what to buy. Most still check marketplaces, reviews, social media, or product content before purchase. (Salsify)
The agentic AI market for retail and ecommerce is valued at $60.43 billion in 2026 and is projected to grow at a 29.29% CAGR through 2031. (Mordor Intelligence)
Exploratory shopping is one of the clearest AI use cases. Attraction-related requests made up 42% of observed chat queries in the same platform AI assistant study. (arXiv)
FAQ: Common Questions About Ecommerce Statistics
What is the biggest ecommerce shift in 2026?
E-commerce numbers indicate that the biggest shift is the buying journey becoming harder to trace. A shopper may discover a product through social content, check reviews elsewhere, then return through search or AI before buying. That makes attribution weaker and product trust more important than a single traffic source.
How should online stores use ecommerce benchmarks?
Benchmarks work when they are compared with store-level data. A market average shown in our ecommerce stats should never replace your own analytics. It should show where to look first.
How is AI changing ecommerce measurement?
AI adds a new step before the site visit. A shopper can compare products, narrow the choice, and arrive with stronger intent before your analytics records the session.
Track it as its own layer:
- AI-referred visits
- Assisted conversions
- Product questions inside AI tools
- Landing pages cited by assistants
- Revenue from AI-led sessions
Why is mobile commerce still a core ecommerce topic?
Mobile commerce matters because it shows whether a store can turn phone traffic into revenue. Compare mobile traffic share with mobile revenue share first. If mobile accounts for 70% of visits but only 45% of sales, the issue is usually with product pages, checkout speed, payment options, or delivery visibility. That gap is more useful than looking at mobile traffic alone. For a deeper look at organic growth, read our ecommerce SEO guide.
Conclusion / Key Numbers to Watch in 2026
Ecommerce statistics in 2026 show a market that still has room to grow, but the pressure now sits inside the buying journey. The headline sales numbers are important. The sharper signals come from conversion, mobile revenue share, cart abandonment, return volume, fraud loss, and AI-referred visits.
Store owners should start with the gap between traffic and revenue. If sessions rise while orders stay flat, the issue may sit in product pages or checkout. If mobile brings in most visitors but accounts for a smaller share of sales, the mobile path needs closer review. If cart abandonment remains high, payment options, delivery costs, and trust signals deserve attention before more budget is allocated to acquisition.
The same logic applies to social commerce and AI traffic. Both can influence shoppers before the final click. A target audience may discover a product through social content, compare it through AI, and return later through search. That makes product pages and category pages more important for ecommerce SEO trends in 2026.
Use these numbers to find the parts of the store where demand turns into lost revenue. If organic search is one of those gaps, SeoProfy’s ecommerce SEO services can help improve visibility and sales performance.

Julia Lubianytska is a Copywriting Team Lead at SeoProfy with over 7 years of experience in copywriting and editing. She works closely with copywriting teams, helping writers craft clear and thoughtful content for SaaS products, IT services, and businesses in the legal and medical fields. Julia enjoys turning complex topics into easy-to-understand, trustworthy content, focusing on structure, clarity, and consistency to ensure the content is genuinely helpful for real people, not just search engines.