

How do you know that your website performs well? Comparing your traffic metrics to average website traffic by industry can help you see if you’re on the right track. These industry benchmarks indicate what is realistic and where your growth opportunities are.
Websites’ traffic statistics work as a GPS for your strategy. If you take them into account, you can set realistic budgets based on your company size and business model, ensuring you don’t overspend on low-intent channels that might lead to you getting traffic but no sales.
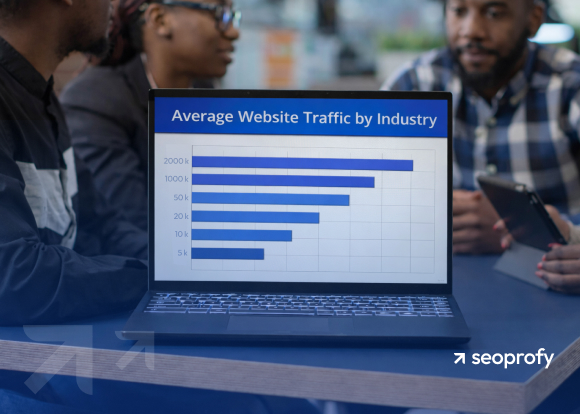
We’ve analyzed the average traffic amounts from organic search and other channels in several industries to provide you with an overview that can guide your SEO approach.
- Average traffic is measured by monthly sessions, which show total visit volume, and unique/new visitors, which determine market reach and brand loyalty.
- Globally, ecommerce platforms get more than 12 million visits per month on average.
- While SaaS and insurance websites usually receive around 600K–900K visits a month, their users are more likely to return.
- Websites of mid-sized companies (up to 500 employees) rarely reach more than 250K monthly visitors.
- Website traffic stats indicate that in B2B and SaaS, 100 targeted visitors are more valuable than 10K generic hits that fail to convert.
- Search engines remain the primary source of web traffic across all major industries.
What Is Considered “Average” Website Traffic?
Technically, average website traffic is the median number of monthly visitors across all sources within a specific industry. This SEO performance metric is measured by aggregating data from similar-sized competitors to establish a “normal” value for a specific niche.
In SEO, averages should be treated with care and interpreted in context. To a retail giant, 50K monthly visitors might signal a crisis, while for a specialized legal firm, that same number represents a market-leading position.
Why Averages Can Be Misleading in SEO
Some abstract averages can be misleading when you use them to evaluate your website’s performance. This is mainly because the truly “normal” range you should aim for depends on three key factors:
- Industry and niche: Ecommerce platforms that serve numerous countries will naturally attract more traffic than local medical practices, for example.
- Website maturity: New sites commonly show lower averages than ten-year-old domains.
- Business model: B2C needs mass volume; B2B SEO statistics indicate that success in this niche is found in smaller, high-intent audiences.
If you don’t consider these factors, you might end up chasing unrealistic objectives. However, it’s also important to understand that the average number of visitors to your site is not a comprehensive performance measure by itself.
Relying solely on a broad website traffic analysis can lead to serious budget allocation issues, such as investing in keywords with high volume but low relevance and the wrong intent, instead of focusing on high-impact, targeted traffic. As a result, you might see a high number of visitors but no revenue growth.
Let’s review the HubSpot case study from late 2024. The HubSpot blog historically dominated search engines by ranking for generic keywords like “famous quotes,” “resignation letters,” and “cover letter examples.” While such an approach generated millions of visits and sessions, they were irrelevant to their core CRM business.
In March and December 2024, Google rolled out core updates to its ranking algorithm that prioritized E-E-A-T. HubSpot’s blog saw its organic search traffic drop from 13.5 million to roughly 2–6 million monthly visits. It was an estimated 70%–80% collapse.
Let’s look at the all-time traffic data for the HubSpot blog:
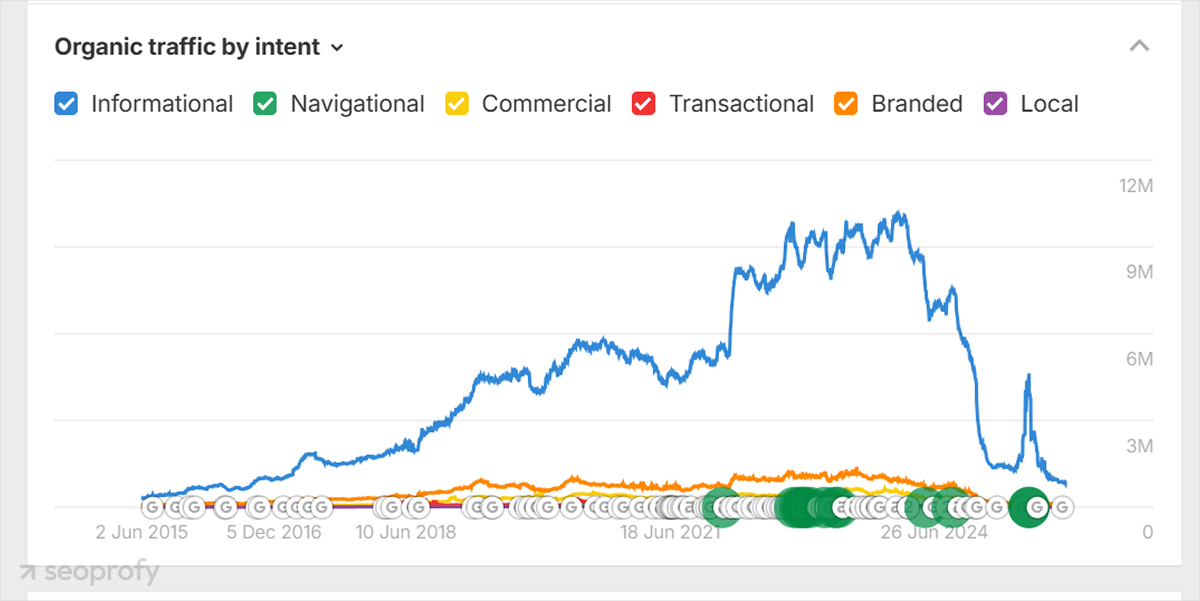
We can see how years of steady growth were wiped out by a massive drop, proving that even the biggest industry leaders are vulnerable to major algorithm changes if they target high-volume keywords that are not relevant to their business.
This screenshot shows a steady decline throughout 2025:
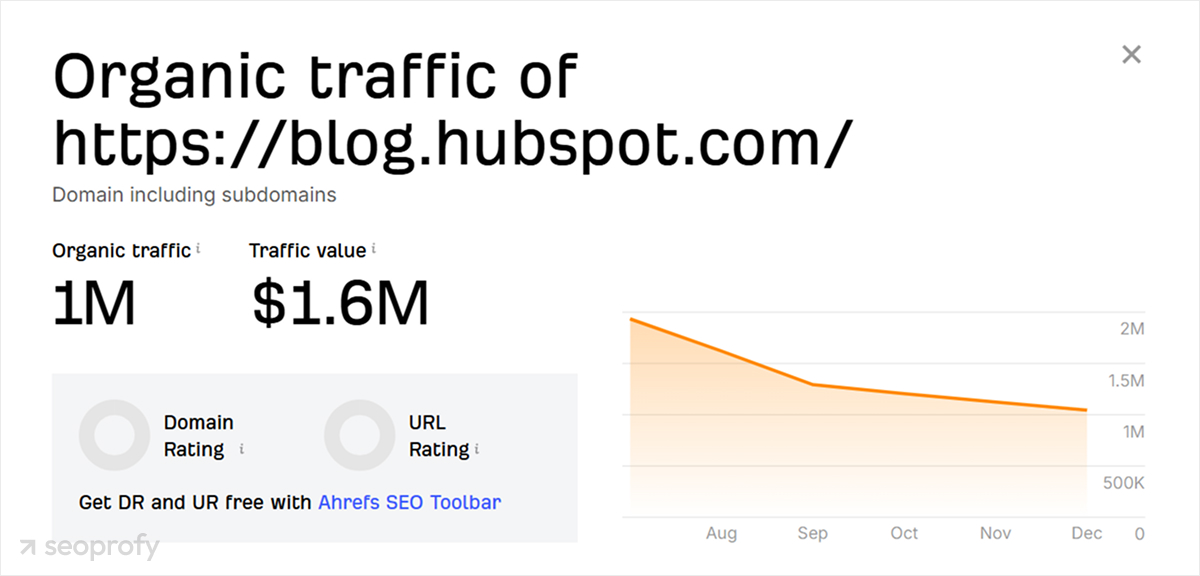
The HubSpot blog was above average in traffic volume but below average in terms of relevance. If you focus on broad search traffic without focusing on your niche, you risk a similar collapse.
Average Website Traffic by Industry
To measure the average website traffic by industry, we analyzed the three-month performance (September–November 2025) of 600 websites. The data were sourced from SimilarWeb. We filtered out extremely high traffic values to get more realistic results for each sector.
However, looking at web traffic alone is like looking at a car’s speedometer without knowing the gear. That is why we have included supplementary traffic metrics like bounce rate, visit duration, and pages per visit. These additional values show how users interact with websites.
The following table summarizes the average website traffic statistics for 100 top-performing businesses across major sectors:
| Industry | Monthly Visits | Unique Visits | Visit Duration | Pages per Visit | Bounce Rate |
| Ecommerce | 12.46M | 3.43M | 8:40 | 10.6 | 27.12% |
| Finance | 9.29M | 2.17M | 7:34 | 8.75 | 28.11% |
| Law | 5.16M | 1.42M | 8:49 | 9.05 | 28.72% |
| Health | 2.45M | 0.89M | 8:58 | 8.52 | 37.11% |
| SaaS | 0.89M | 0.83M | 8:03 | 3.13 | 35.59% |
| Insurance | 0.6M | 0.26M | 7:54 | 9.11 | 24.59% |
| Real Estate | 5.55M | 1.57M | 8:03 | 13.43 | 29.39% |
| Accommodations and Hotels | 5.62M | 2.18M | 9:30 | 14.17 | 25.94% |
| Telecommunications | 5.46M | 1.35M | 6:38 | 7.92 | 30.02% |
| Education | 30.31M | 6.25M | 6:27 | 7.29 | 34.72% |
| Marketing and Advertising | 1.611M | 0.655M | 6:56 | 7.12 | 35.39% |
| News and Media | 65.54M | 9.16M | 8:10 | 5.14 | 44.27% |
| Consumer Electronics | 9.05M | 4.57M | 6:01 | 5.92 | 37.87% |
| Automotive | 1.69M | 0.46M | 1:41 | 7.18 | 28.19% |
| HR and Employment | 0.92M | 0.27M | 4:31 | 4.47 | 43.31% |
| Shipping and Logistics | 6.07M | 5.97M | 8:07 | 5.38 | 34.21% |
| Web Design | 13.37M | 3.56M | 5:09 | 5.62 | 41.38% |
| Energy | 1.39M | 0.47M | 5:31 | 6.72 | 26.40% |
| Fashion and Apparel | 9.02M | 3.27M | 6:36 | 10.92 | 26.79% |
| Pharmacy | 1.47M | 0.39M | 6:25 | 6.12 | 39.79% |
To provide you with more granular insights, we compiled a table of traffic averages by industry, considering a search ranking position. Giants are the companies ranking 1-10, challengers take positions 11-100, and up-and-comers appear at 101-1000:
| Industry |
Giants (1-10) |
Challengers (11-100) |
Paid Search (101 – 1,000) |
| Accommodation & Hotels | 17.1m | 669.1K | 48.6K |
| Air Travel | 12.2M | 649.4K | 68.8K |
| Finance | 63.0M | 14.1M | 497.5K |
| Food & Drink | 11.5M | 2.2M | 426.3K |
| Insurance | 9.6M | 1.3M | 234.1K |
| News & Media | 204.0M | 8.1M | 926.8K |
| Beauty & Cosmetics | 3.3M | 340.2K | 60.5K |
| Home & Garden | 12.5M | 924.1K | 133K |
| Jewelry & Luxury | 785.1K | 174.9K | 22.2K |
| Consumer Electronics | 17.1M | 900.8K | 51.6K |
| Pet Food & Supplies | 3.4M | 360.9K | 41.6K |
| Fashion & Apparel | 11.9M | 78.4K | 16.7K |
The ecommerce sector shows the highest traffic and engagement, indicating a trend of frequent browsing for the choice of products. SaaS features much lower traffic, but with the same high engagement metrics, which proves that users really explore the content in search of a solution. The health industry features the highest bounce rate across other sectors, but still has a high return rate (up to three sessions per user on average).
Average Website Traffic by Company Size
Let’s be honest: comparing a local clinic’s web traffic to a global hospital network isn’t fair. While industry averages give you a “north star,” your actual traffic potential depends heavily on your resources and team size.
To give you a better idea of what “normal” looks like for your specific scale, we’ve broken down HubSpot’s data. They surveyed over 400 SEO experts to see how monthly web traffic depends on company size (by employee count).
| Company Size (Employees) | 1K–15K Visitors | 15K–50K Visitors | 50K–250K Visitors | 250K–10M Visitors | 10M+ Visitors |
| Fewer than 10 | ~50% | ~42% | 0% | ~8% | 0% |
| 11 to 25 | ~73% | ~20% | ~7% | 0% | 0% |
| 26 to 200 | ~60% | ~21% | ~19% | 0% | 0% |
| 201 to 500 | ~46% | ~13% | ~30% | ~11% | 0% |
| 501 to 1,000 | ~35% | ~24% | ~26% | ~15% | 0% |
| 1,001+ | ~26% | ~16% | ~29% | ~26% | ~3% |
What this means for you:
- Small teams (under 25): Most of these sites (73%) get from 1K to 15K visitors.
- The “mid-market” jump: Once a company grows to 200 employees, traffic tends to explode. About 30% of these businesses manage up to 250K visitors monthly.
- Enterprise scaling: Only the biggest players (1,000+ staff) manage to attract more than 10M visitors each month.
Website Traffic Benchmarks by Acquisition Channel
These benchmarks are vital. They do not just show you the averages; they give you a clear understanding of how your competitors succeed. When you see a specific channel, like search engines or social, holding a massive share across multiple websites, it’s a direct signal that the channel is working.
High website traffic benchmarks in a specific acquisition channel prove that it drives relevant, converting traffic. If the leaders in your industry heavily invest in a source, that’s where you’ll find your most profitable audience.
For quality traffic growth, you can’t just guess about industry trends. You need to know which channels are actually “standard” for your niche. We analyzed data from the SimilarWeb 2024-25 Marketing Benchmark Report to see how top sites actually get their users.
| Industry | Direct | Organic Search | Paid Search | Referrals | Social | Display/Email |
| Accommodation & Hotels | 53% | 23% | 12% | 6–7% | ≤1% | ≤2–3% |
| Air Travel | 55% | 31.8–33% | 6–9% | 6–7% | ≤1% | ≤1–2% |
| Finance | 72.70% | 12.20% | 2–4% | 8.90% | ~1% | 1–3% |
| Food & Drink | 46.90% | 37.90% | 4–5% | 6.20% | ≤1% | ≤2% |
| Insurance | 61% | 20% | 3–6% | 20% | ~1% | 9–12% |
| News & Media | 68% | 21% | ≤1% | 8% | ≤1% | ≤1% |
| Beauty & Cosmetics | 48% | 27.9% | 10.8% | 4.0% | 2.6% | 5.7% |
| Home & Garden | 40.8% | 37.0% | 12.5% | 2.1% | 2.1% | 5.5% |
| Jewelry & Luxury | 39.97% | 28.92% | 17.43% | 2.64% | 2.96% | 8.07% |
| Consumer Electronics | 43.24% | 36.81% | 6.51% | 7.51% | 2.48% | 3.54% |
| Pet Food & Supplies | 53.32% | 20.29% | 15.38% | 4.40% | 2.62% | 3.99% |
| Fashion & Apparel | 47.80% | 21.46% | 15.15% | 1.67% | 3.82% | 10.10% |
Despite AI Overview and LLMs being a hot topic in digital marketing, and Semrush estimating that AI will start bringing more traffic than search engines by 2028, chatbots and AI search still account for less than 1% of total visits. Data from BrightEdge shows that traditional search remains the priority traffic channel:
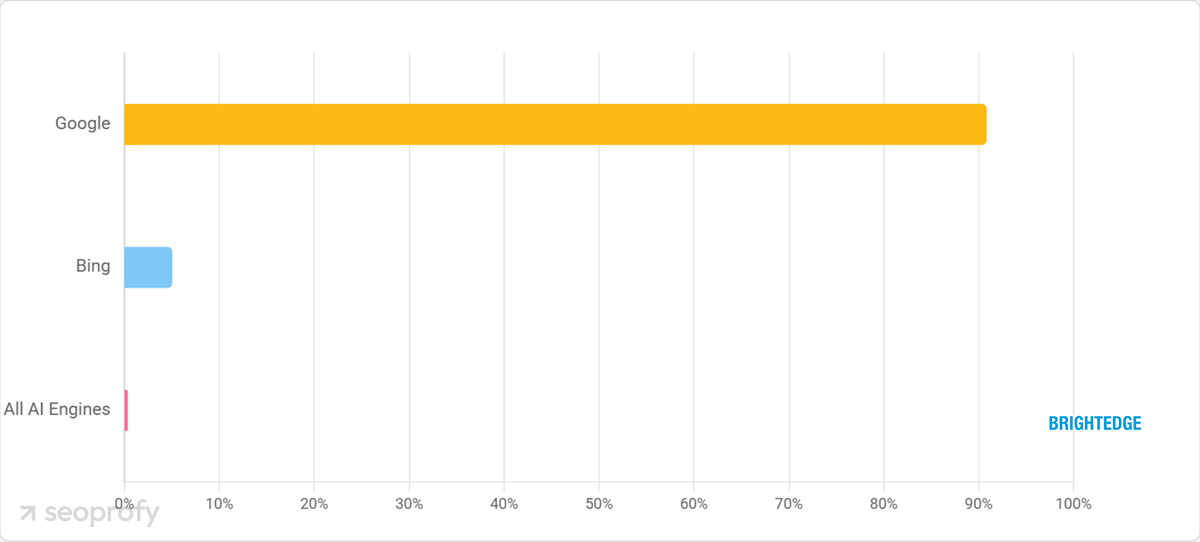
Among AI engines as traffic channels, ChatGPT dominates the market:
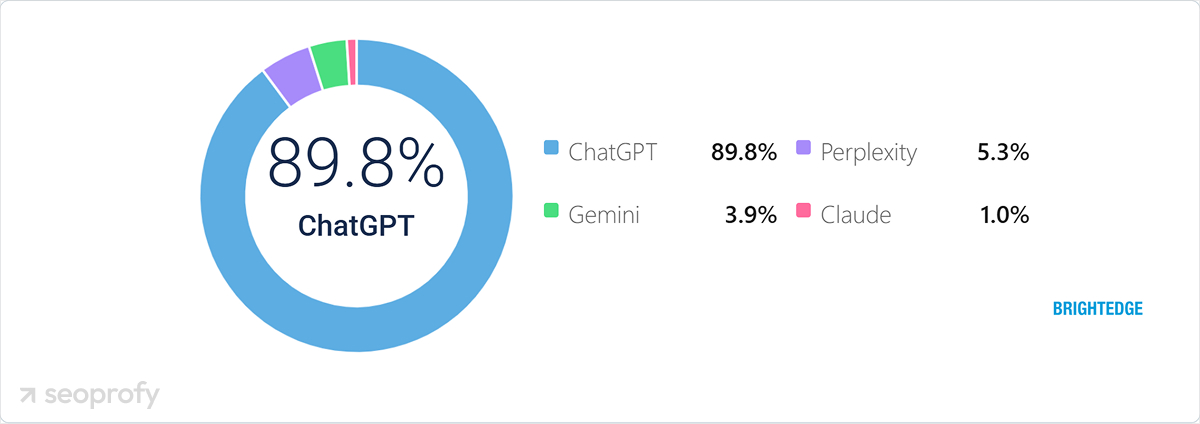
Plus, ChatGPT statistics show that it consistently ranks among the five most visited websites. That’s why many businesses start to think about how to get mentioned by ChatGPT and benefit from its growing potential.
Why Website Traffic Varies Between Industries
Different industries have different traffic patterns because of how people search. In real estate, people return to the same site often to check listings, while in health, people use Google to find quick answers.
These differences aren’t accidental. They are caused by the way each industry operates. Understanding these “why” factors helps you set realistic goals instead of tracking website traffic benchmarks that don’t apply to your business model.
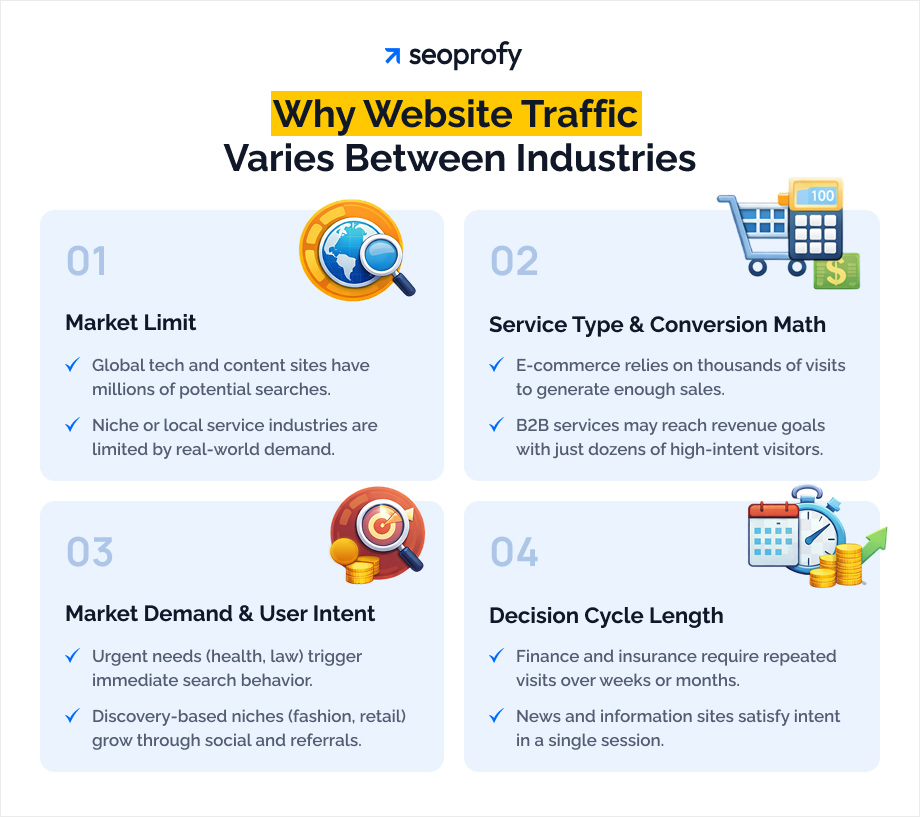
The Market Limit
Every industry has a different limit for how much total traffic actually exists.
A tech blog has a massive global audience with no geographical boundaries and millions of potential keywords to rank for. But a company that provides industrial crane repair services has a very limited pool of potential customers. No matter how perfect and professional their SEO strategy is, they will always get lower traffic because the total search demand for that specific service is small.
Service Type and Conversion Math
The most basic reason for traffic variation is the “volume vs. value” equation.
For example, a typical e-commerce store has an average conversion rate of about 2.5%. To generate enough orders to stay profitable, that company needs dozens of thousands of visits every month. High traffic is the only way to make the equation work.
On the other hand, a niche B2B consulting firm might only need 100 visitors per month, because selling high-cost services and converting just one or two clients from those 100 visitors generates enough revenue to meet their entire target. In this case, a massive surge in “cheap” traffic would actually be a distraction.
Market Demand and User Intent
The way users find you is a reflection of how they feel when they need your help.
In the health or law industries, the user search intent is usually urgent and specific. When people face a problem they cannot solve on their own, such as a medical symptom or a legal crisis, they don’t wait for a social media ad to appear. They start researching right away, turning to search engines for quick results.
In contrast, retail and fashion often thrive on “passive discovery.” A user might not be looking for a new jacket until they see it on a social feed. These niches can maintain high traffic through social and referral channels because their products are “shareable” in a way that a legal contract or a medical diagnosis is not.
The Length of the Decision Cycle
How long it takes a customer to make a decision also changes your traffic mix.
Buying insurance or choosing an investment plan in finance takes weeks or months. A user might find the site through a Google search on day one, but they will return through a direct link dozens of times over the next month to review the details. This is why these industries show such high “direct” benchmarks — it’s a sign of a long research process.
In general news or information niches, the cycle is immediate. A user gets their answer and leaves. Since there is no reason to return daily, these sites need to constantly acquire brand-new visitors through search to keep their numbers up.
Don’t just look at your total visitor count. You need to check if your traffic comes from the right sources for your business. For example, if you sell expensive services that require a longer consideration stage, you need direct visits. If nobody is coming back to your site directly, it means you aren’t building enough trust to turn a one-time visitor into a customer.
How to Tell If Your Website Traffic Is “Good” for Your Industry
“Good” traffic in SEO is defined by your business goal, not just the number of people actually coming to your website. To understand if your numbers are healthy, you need to look at which category your business falls into:
The High-Volume Model (Selling Products or Ads)
This mostly applies to online stores or content-focused sites (news/blogs). This business model suggests you make a small amount of money from each visitor. Because most people who visit a store don’t buy anything (with the average conversion rate of about 2.5%), you need a massive amount of web traffic to reach a profit threshold.
- The math: 1,000 visitors × 2.5% conversion = 25 sales.
- The goal: If 25 sales aren’t enough to cover your bill needs, you should either increase your traffic to 10,000 or find more interested, ready-to-buy visitors.
- Is it good? Only if the final volume is high enough to reach your revenue goals.
The High-Value Model (Selling Expensive Services)
This applies to consultants, law firms, or software companies (B2B). In these businesses, a single customer can bring thousands of dollars. You don’t need a million visitors; you only need the right ones.
- The math: 100 visitors × 5% lead rate = 5 potential clients.
- The goal: If these 5 users are high-quality leads, your website is super successful. You don’t need more traffic; you just need to focus on attracting and engaging those specific visitors.
- Is it good? Yes, if the small amount of traffic you have brings you to the set goals.
How to Evaluate Your Performance: A Step-by-Step Roadmap
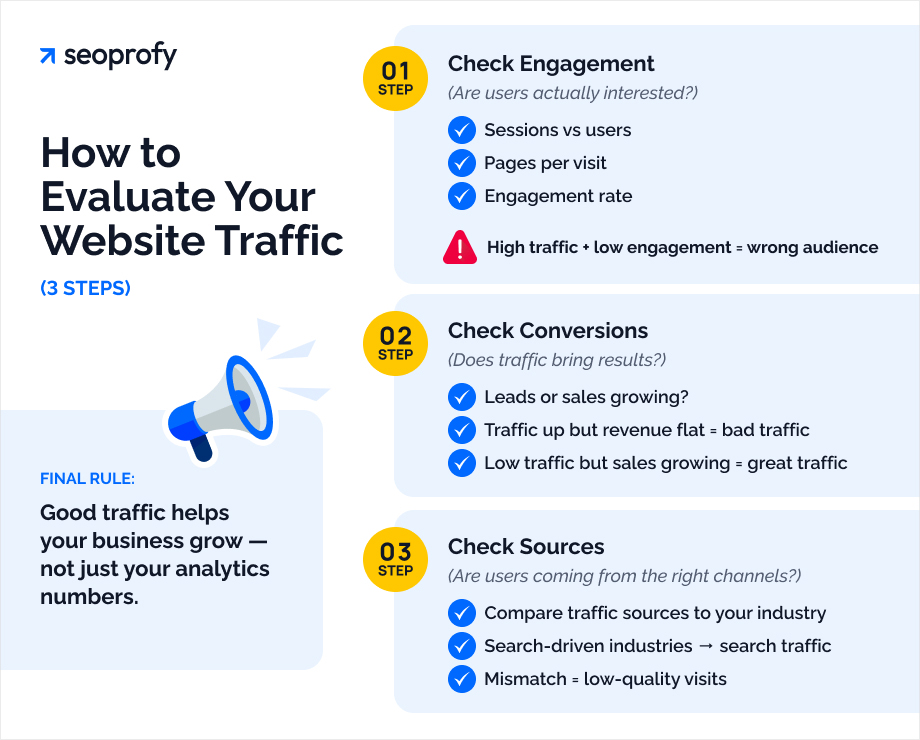
To stop guessing and start calculating if your traffic is good, follow these three steps:
Step 1: Check the Basic Metrics
To determine your true “normal,” you should look beyond raw visits and analyze websites’ traffic statistics through three primary lenses:
- Total sessions and unique visitors: A session is a single visit, while a unique visitor is an individual. If there are more sessions than visitors, this indicates a strong brand loyalty, meaning a single visitor returns to the website regularly. And vice versa, if the two numbers are the same, focus on audience retention to bring people back.
- Pageviews and depth: This measures how many pages a user visits. High web traffic with low page views signals that your content isn’t engaging and your website is wasting the target audience. Your primary task here will be not to boost search traffic but to improve navigation and content relevance to keep users moving through the funnel.
- Engagement rate: In 2026, it is important to focus on active users. A low engagement rate indicates ranking for the wrong terms. In this case, you need to refocus your content strategy toward high-impact, targeted queries that solve the user’s specific problem.
These metrics can be checked in Google Analytics and Google Search Console.
Step 2: Evaluate Your Conversion Rate
Next, check your leads or sales. If your traffic is growing but your sales stagnate, then your traffic is bad. It indicates that you attract the wrong audience. If your sales are growing but your traffic is low, your traffic is excellent, but you need more of it. In this case, you should opt for professional SEO services. We suggest checking our guide to SEO conversion rates to see how healthy metrics convert into business results.
Step 3: Compare Your Sources to the Industry
Check back on the tables we provided above. If you operate a law firm but most of your traffic comes from social media instead of paid or organic search, you are likely getting “browsers” instead of real clients who need a lawyer. Good traffic is generated by the channels where your customers look for help.
Your website traffic is good if it helps your business scale. If 500 visitors a month stimulates you to hire more staff, add new services or products, and grow your revenue, that is better traffic than 50K visitors who never buy anything and don’t lead to growth.
Common Mistakes When Using Website Traffic Benchmarks
Checking your traffic against website traffic benchmarks by industry is helpful, but you can easily misinterpret the data. Here are the most common errors to avoid:
1. Focusing on Quantity Over Quality
Many business owners measure website success in traffic values. Some SEO experts also use growing traffic values as an indicator of a suggested strategy. But this is not true if the visitors don’t match your business goals. Focus on attracting users who have a specific need for your solutions, even if the total number is smaller.
2. Expecting Immediate Direct Visitors
Leading global brands get a lot of direct traffic because people already know their names. But new or smaller websites, especially local ones, often interpret it as a failure if people don’t type their URL directly into the browser. You need to understand that direct visiting takes years of brand building. For most growing websites, search will and should be the primary source of users for a long time.
3. Ignoring Seasonality
Traffic volume changes depending on the month or season. For example, a fitness or travel site might see a drop in organic traffic in the fall and misinterpret the result as an SEO fail. But in this case, you need to compare your data to the same month from the previous year. This tells you if the metric shows performance issues or is just following a seasonal trend.
4. Comparing Yourself to Different Business Models
Comparing a small local service to a global information portal is a mistake. The target audience sizes and their intents can be completely different. You should only compare your website to direct competitors who offer the same services in the same geographic area or are as similar to yours as possible.
Key Takeaways: Using Website Traffic Benchmarks Effectively
Website traffic by industry is a useless metric if taken out of context. The most important thing is to focus on traffic quality rather than total volume. 100 visitors who actually buy your service are better than 10K who leave immediately.
You should also align your strategy with your industry’s most effective traffic sources. If your competitors succeed through search, you need to prioritize SEO to get on top of the SERP. Measure your growth against your own past performance, direct competition, and your specific business goals.
Don’t waste your budget chasing wrong website traffic benchmarks and exploring which channels work for you by trial and error. As a team of SEO experts with 13 years of practical experience, SeoProfy analyzes your specific niche to find the most profitable opportunities and increase organic traffic to your website. We help you estimate your real potential and build a plan that focuses on business goals and revenue, not just metrics.
Contact SeoProfy today to optimize your strategy and stop wasting your marketing resources.

Julia Lubianytska is a Copywriting Team Lead at SeoProfy with over 7 years of experience in copywriting and editing. She works closely with copywriting teams, helping writers craft clear and thoughtful content for SaaS products, IT services, and businesses in the legal and medical fields. Julia enjoys turning complex topics into easy-to-understand, trustworthy content, focusing on structure, clarity, and consistency to ensure the content is genuinely helpful for real people, not just search engines.