


Branding has always mattered in digital marketing, and with the appearance of AI tools, it’s getting even more attention. Search engines and AI systems increasingly lean on brand signals — such as reputation, consistency, and user behavior — when deciding what to surface, which is why recognizable brands tend to show up more often in rankings and AI answers.
To understand how that plays out in real numbers, our team at SeoProfy analyzed recent studies, CMO surveys, industry reports, and consumer data to compile this list of branding statistics for 2026. Together, they show how strong branding drives business growth and revenue, and how you can adjust your marketing strategy to capture more of that impact.
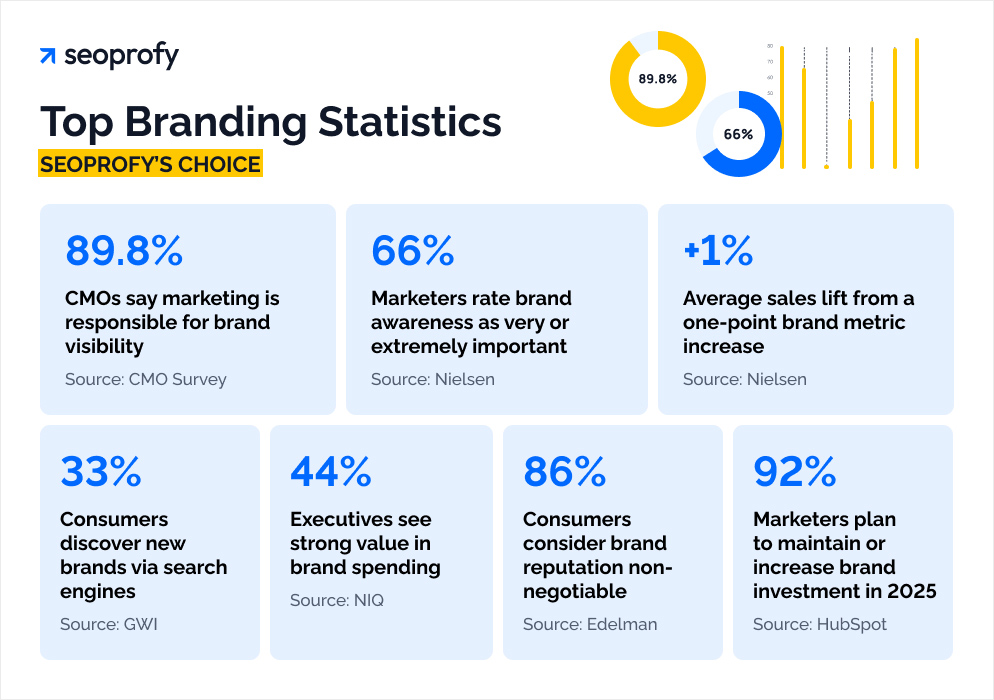
- 89.8% of CMOs said that marketing at their company is primarily responsible for brand visibility.
- Brand awareness ranks as the most important marketing metric, and 30% of marketers rate it “extremely important,” while 36% rate it “very important.”
- On average, even a one-point lift in brand metrics like awareness or consideration leads to about a one percent increase in sales.
- Search engines are one of the main channels for brand discovery, used by 33% of consumers to find new brands.
- 44% of the executives at the top level, such as CEOs and CFOs, are seeing strong value in brand spend.
- 86% of consumers rate brand reputation, and 87% rate high-quality customer service as important or non-negotiable in their purchase decisions.
- 92% of marketers plan to maintain or increase investments in brand image in 2025.
General Branding Statistics
Companies are spending more on marketing and brand recognition than they did a few years ago. The investment seems to be working, based on what we’re seeing in brand value growth. But even though many marketing leaders know their branding work has an impact, they have a hard time connecting the direct line between brand spending and revenue. Let’s look at the stats that show this:
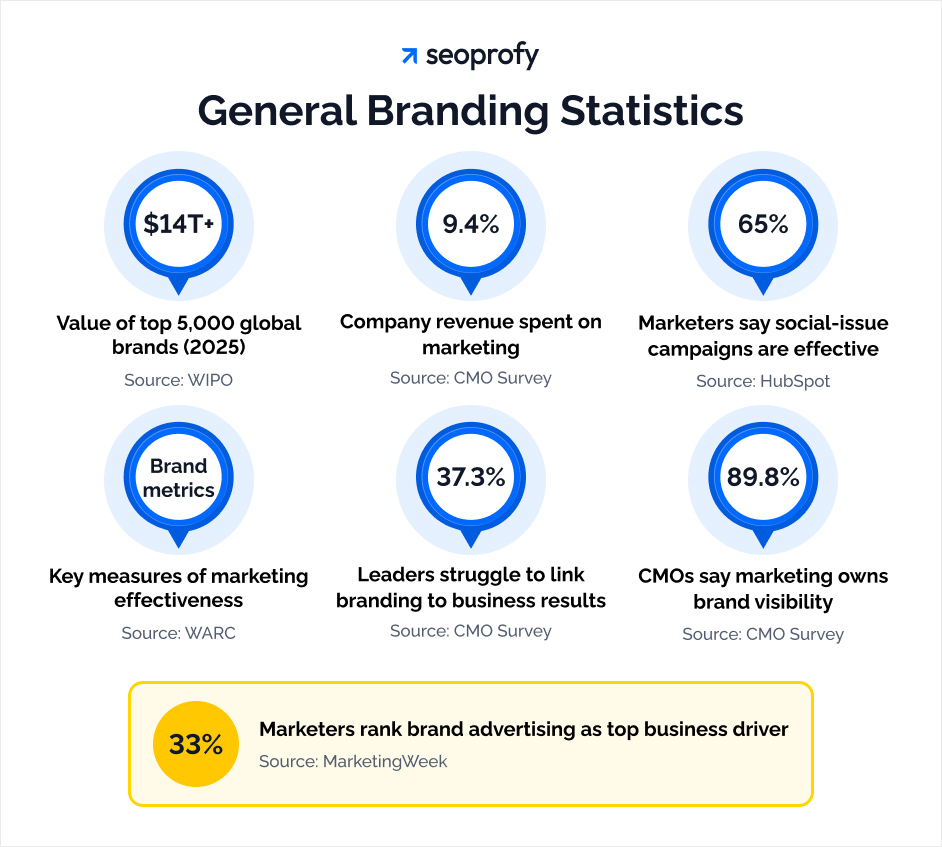
- The combined value of the world’s 5,000 biggest corporate brands grew from USD 13.2 trillion in 2024 to more than USD 14 trillion in 2025 (WIPO)
- Marketing budgets now account for 9.4% of company revenue, up from 7.7% in the previous survey wave, as more companies direct spending toward marketing and brand strategy (CMO Survey)
- 65% of marketers said that featuring social issues in their 2024 campaigns proved effective for their brand. (HubSpot State of Marketing Report)
- Brand metrics are recognized as some of the most impactful measures of effectiveness for marketers. (WARC)
- Many marketing leaders still find it difficult to explain how branding fits into business decisions, and this challenge slightly increased from 36.9% in 2023 to 37.3% in 2025. (CMO Survey)
- 89.8% of CMOs said that marketing at their company is primarily responsible for brand visibility. (CMO Survey)
- 33% of more than 1,200 marketers name brand advertising as the top tactic for achieving business objectives. (MarketingWeek)
Global and Regional Branding Statistics
Brand value varies quite a bit depending on where you look. Some countries invest heavily in their brands, and certain industries dominate the global rankings. The stats below show which regions put the most money into branding and where brands make up the biggest portion of economic value.
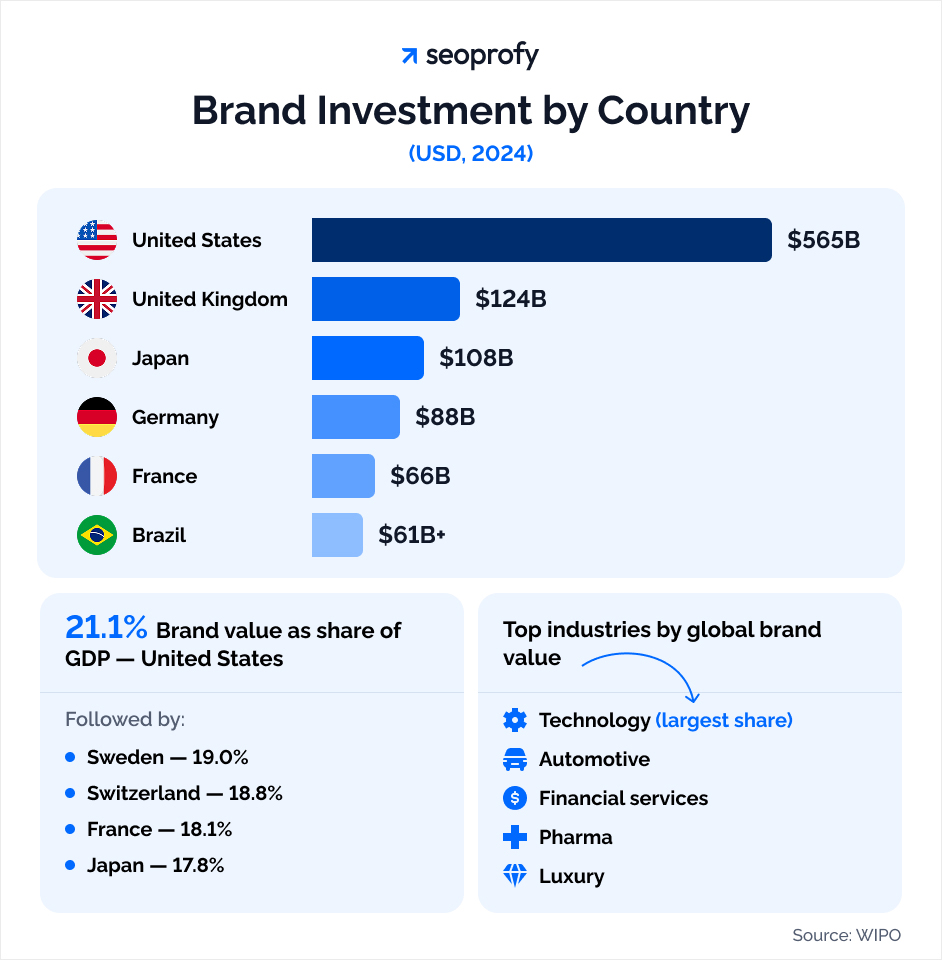
- The United States ranks as one of the biggest spenders on brands, at over USD 565 billion in 2024. The United Kingdom invests around USD 124 billion, Japan about USD 108 billion, Germany USD 88 billion, France USD 66 billion, and Brazil more than USD 61 billion. (WIPO)
- Looking at brand value relative to GDP, the United States leads at 21.1%, followed by Sweden (19.0%), Switzerland (18.8%), France (18.1%), and Japan (17.8%). (WIPO)
- Technology brands hold the largest share of global brand value, while automotive, financial services, pharmaceutical, and luxury brands also take up a major part of the rankings. (WIPO)
Brand Awareness Statistics
Brand awareness continues to be one of the top metrics marketers care about in 2025. As for the channels, search engines, TV ads, word of mouth, and social ads seem to show the best results. We’ve also seen similar data in our SEO statistics, which show that over half of customers use Google as a channel to find new brands.
For companies, this means it’s worth leaning into the mentioned marketing channels and trying to connect with the target audience through high-quality content that shows their values and builds customer loyalty. Let’s look at the branding data that supports this:
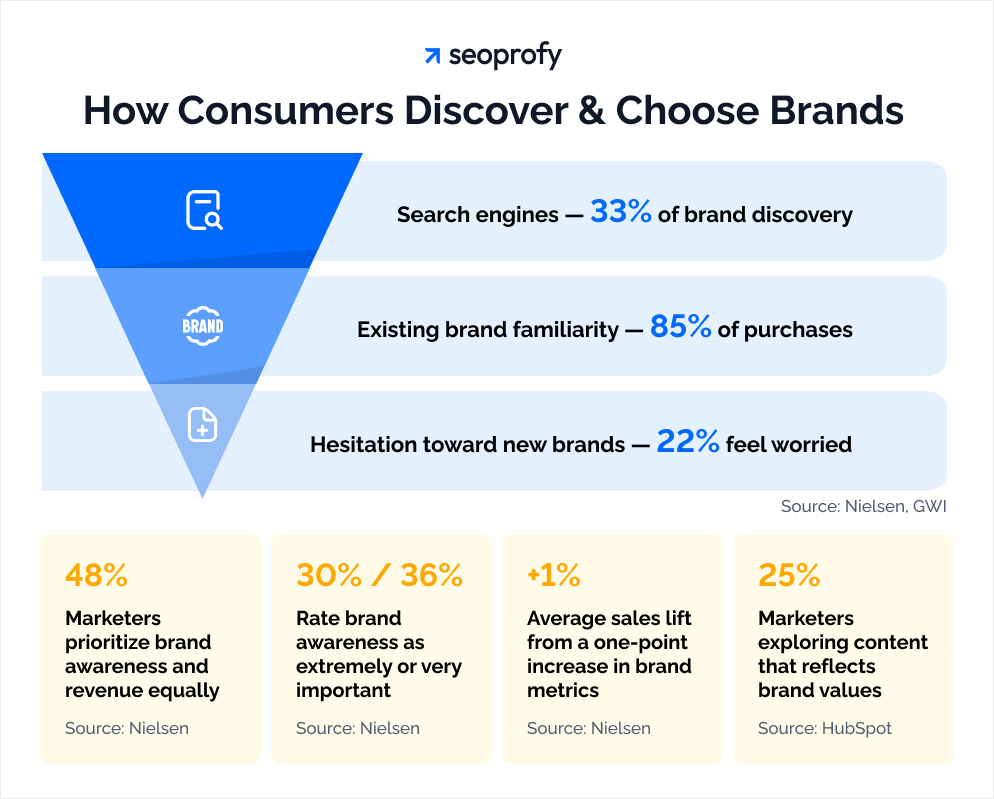
- 48% of North American marketers say they give equal priority to revenue growth and brand awareness. (Nielsen)
- 1 in 4 marketers are currently exploring creating content that reflects their brand’s values. (HubSpot State of Marketing Report)
- Search engines are one of the main channels for brand discovery, used by 33% of consumers to find new brands. (GWI)
- Brand awareness ranks as the most important marketing metric, and 30% of marketers rate it “extremely important,” while 36% rate it “very important.” (Nielsen)
- On average, even a one-point lift in brand metrics like awareness or consideration leads to about a one percent increase in sales. (Nielsen)
- In the purchase-journey analysis, 85% of purchases involved brands the customer had already tried, and 22% of consumers say they felt worried about trying a new brand. (Nielsen)
Social Media Branding Statistics
Our digital marketing statistics show that 53% of U.S. users stay loyal to brands they follow on social media. Consumers now check Instagram, YouTube, and other channels daily, which means brands need to stay visible on these platforms consistently and create content that resonates with their audience to keep that connection alive.
The research also shows that engagement is going up. More people are interacting with brands on social media than they were six months ago, and those repeated touchpoints help build trust. Let’s look at the branding trends that show this:
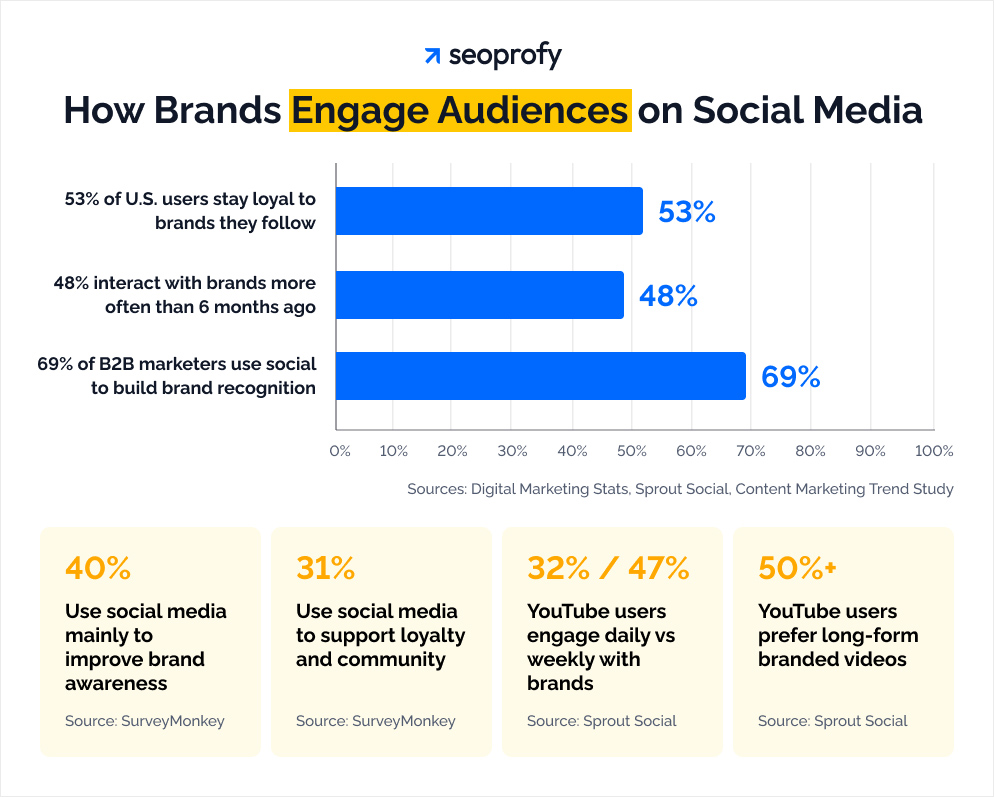
- Social media is one of the leading channels for B2B marketers, and 69% use it to increase brand recognition and connect with their audiences. (Content Marketing Trend Study)
- 40% of marketers use social media platforms mainly to improve brand awareness, while 31% use them to support loyalty and community. (SurveyMonkey)
- 48% of consumers interact with brands on social media more often than they did six months ago. (Sprout Social)
- 32% of YouTube users say they engage with brands on a daily basis, while 47% connect with them weekly. (Sprout Social)
- More than half of YouTube users say they are most likely to engage with long-form videos from brands. (Sprout Social)
- On Instagram, users interact most often with short-form videos, static images, sponsored influencer content, and GIFs or memes. (Sprout Social)
Branding Statistics Around Consumer Expectations
Consumers have mixed feelings about brands these days. Most people say brand messages don’t match what they need or care about, and a good portion are willing to switch companies if the price is better. On the other end of the spectrum, consumers seem to pay more for the brands when they find ones that feel authentic.
As a business, you need to think of a way to communicate your brand identity across channels with messaging that matches what your target audience values and needs. Let’s look closer at the branding statistics that support this.
- 88% of consumers say most brand messages don’t reflect their needs or values. (EY Future Consumer Index)
- 65% of respondents said the brand matters a lot to them when they buy a product. (Amazon Higher Impact Study)
- 36% of consumers say they no longer consider brands when deciding what to buy. (EY Future Consumer Index)
- 62% of people globally say they’d try a new brand if the price is lower. (NielsenIQ Global Survey)
- 64% of respondents say they are ready to pay more for brands, products, and services they see as authentic. (Amazon Ads, Higher Impact Study)
- 86% of consumers rate brand reputation, and 87% rate high-quality customer service as important or non-negotiable in their purchase decisions. (Edelman)
Trust and Brand Loyalty Statistics
The topic of trust and loyalty is something every brand cares about. As data shows, people consider it alongside price and product quality when deciding what to buy. And when that trust is earned, consumers are more likely to recommend it to people they know.
What this means for companies is that trust is one of the assets you need to actively build in your branding strategy. You can do that by keeping your product standards high and being upfront about your values, especially around sustainability. Here are the stats that show it:
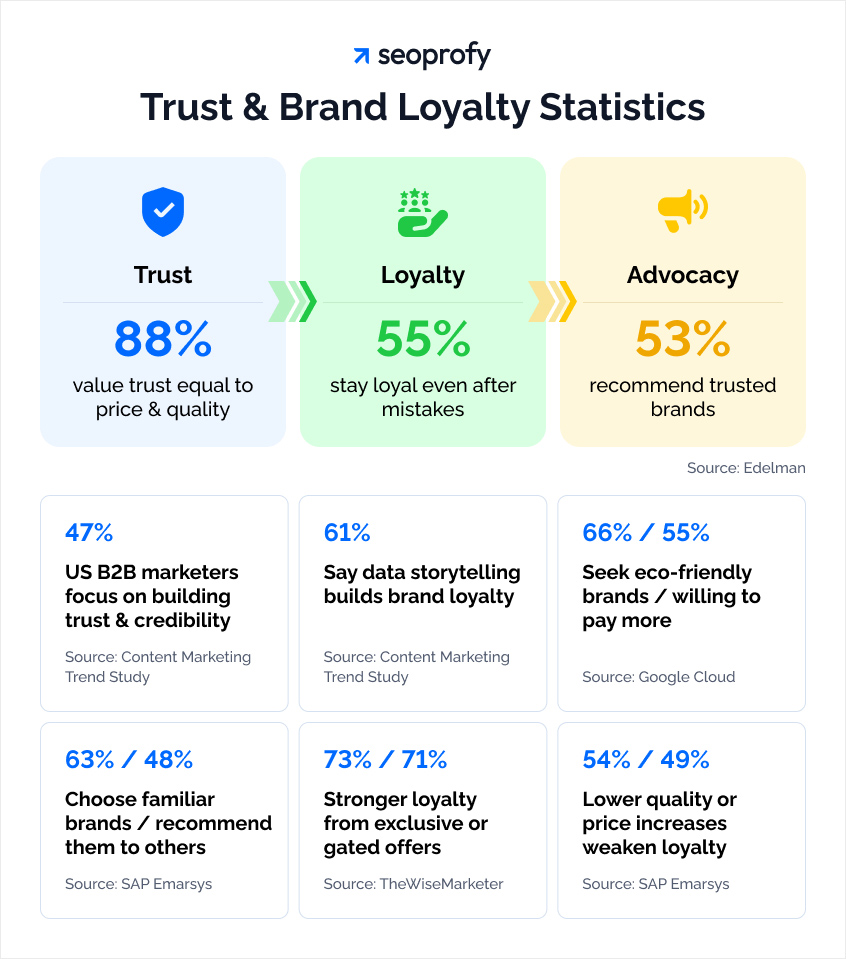
- 88% of consumers see trust as equally important to price and quality when choosing which brands to buy from. (Edelman)
- Building trust and credibility is a top goal for 47% of US B2B marketers using digital content marketing, just behind brand awareness at 59% and employer branding at 57%. (Content Marketing Trend Study)
- 61% of brand marketers say data storytelling helps build brand loyalty over time. (Content Marketing Trend Study)
- 66% of people are searching for eco-friendly products, and over half of them (55%) are happy to spend more money for sustainable brands. (Google Cloud)
- 55% of consumers say they would stay loyal to a brand they fully trust, even if it makes a mistake or faces public criticism. (Edelman)
- 53% say they would recommend a fully trusted brand to other people. (Edelman)
- 63% of people say they often choose products from brands they already like, and 48% say they show loyalty by recommending those brands to others. (Sap Emarsys)
- 73% of respondents say they feel a stronger emotional connection to brands that offer something exclusive or gated, and 71% say these offers make them stay more loyal. (TheWiseMarketer)
- 54% of consumers say lower product quality weakens their loyalty to a brand, and 49% say price increases have the same effect. (SAP Emarsys)
- 28% of consumers say brand consistency is one of the reasons they stay loyal to a company. (Sap Emarsys)
Personal Branding Statistics
Our data shows that employees can be your biggest brand asset. At some point, your customers need to see the humans behind your logo and believe that those people care about them. Personal brands from your leadership and team members can help build that connection.
So, encourage your employees to post more on platforms like LinkedIn. This will add personality to your brand and make your company more relatable. Here are the numbers that back this up:
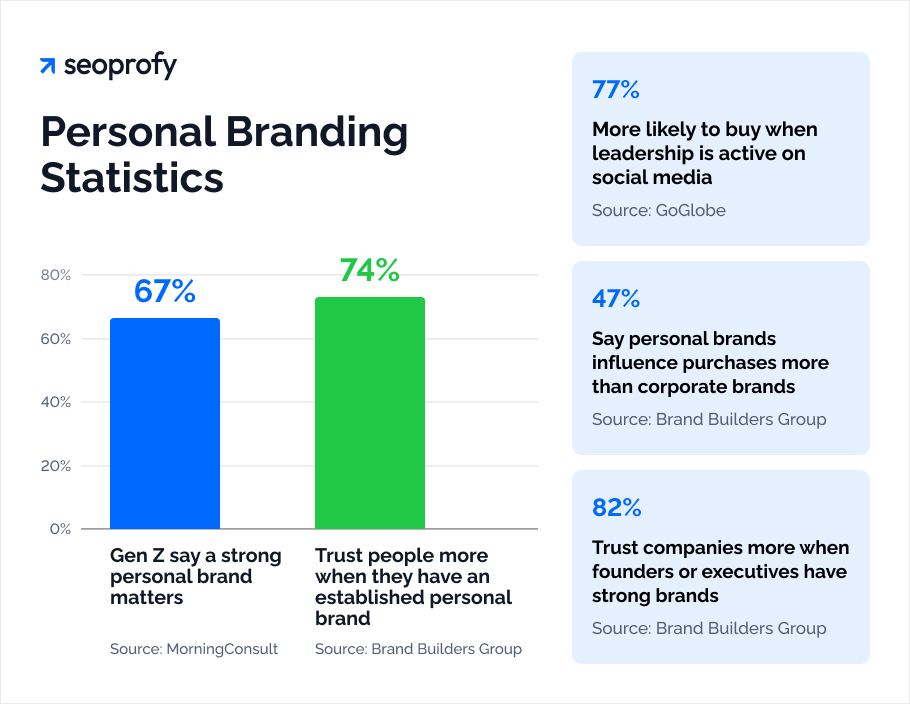
- 67% of Gen Z adults say a strong personal brand matters to them. (MorningConsult)
- 74% of people say they are more likely to trust someone who has an established personal brand. (Brand Builders Group)
- 77% of consumers say they are more likely to buy from a company when its CEO and leadership team are active on social media. (GoGlobe)
- 47% of Americans say a personal brand is more influential in their purchasing decisions than a corporate brand. (Brand Builders Group)
- 82% of consumers agree that companies feel more influential when their founder or executives have a brand that people know, trust, and follow. (Brand Builders Group)
Future Trends in Branding
Recent surveys from WARC, Nielsen, NIQ, and HubSpot point to bigger long-term bets on a brand. Companies are also putting a consistent brand presentation higher on their planning agendas than they did a few years ago.
The other thing we’re seeing is more investment in AI marketing and social media. Brands are doubling down on this channel because they’re seeing results. If you’re planning your 2026 budget and wondering where to put your money, the stats below can help show what companies plan to keep doing and where they plan to invest next year.
- 92% of marketers plan to maintain or increase investments in brand awareness in 2025. (HubSpot State of Marketing Report)
- 44% of the executives at the top level, such as CEOs and CFOs, are seeing strong value in brand spend (NIQ)
- 36% of marketers worldwide plan to increase their investment in online brand presence this year (WARC)
- 78% of marketing teams plan to expand their use of AI this year. (DEPT)
- 67% of senior marketers are already using AI for brand health measurement (NIQ)
- 52% of marketers say they will invest more in social media in 2025, which shows how important this channel has become for building a valuable brand. (SurveyMonkey)
- 13% of marketers plan to invest in brand awareness for the first time in 2025. (HubSpot State of Marketing Report)
Together, these numbers show that brand value is especially concentrated in mature economies, and that tech, automotive, financial services, pharma, and luxury brands dominate the global rankings.
Takeaways
If our statistics show one thing, it’s that branding remains a top priority for marketing teams and often leads to more loyal customers and higher ROI. What seems to work best for branding efforts is an omnichannel presence across search engines, social media, and TV ads, with a combination of human-led content marketing that shows your brand personality and helps potential customers feel confident choosing you.
And even though it requires lots of effort from multiple teams and alignment with brand guidelines, in the end, it amplifies all other strategies and can lead to better LTV indicators and happy customers that stay loyal and recommend your business.

Khrystyna Dzhumaryk is a content writer at SeoProfy with four years of experience in SEO and content strategy. At the company’s main blog, she writes in-depth articles and guides to help businesses improve their online visibility through proven tactics. Her work brings together hands-on SEO experience with ongoing research into algorithm updates, search trends, and the growing impact of AI on content and optimization.